k8s的监控方案
方案选型
如果已存在完善的监控系统的话,推荐使用k8s原生的heapster,比较轻量,容易集成。
我选择的是prometheus, 它是比较完善的云平台级监控方案,继k8s之后同样已被列入云计算基金会项目, 除了具备heapster的能力之外,还支持监控广泛的应用(mysql, JMX, HAProxy等)和灵活的告警的能力,并具备多IDC federation的能力,兼容多种开源监控系统(StatsD, Ganglia, collectd, nagios等)。
本文主要参考
下面分别介绍下两种方案
heapster
-
heapster的介绍:
通过向kubelet拉取stats的方式, 可提供15分钟内的缓存供k8s的dashboard用,也支持第三方存储,如influxdb等,还具备REST API(经我实验,这个API还不完善 缺少diskIO API).
-
heapster的监控范围
可监控的内容包括集群内的Container, Pod, Node 和 Namespace的性能或配置信息, 目前container级别还不支持网络和硬盘信息,具体性能项如下
| Metric Name | Description |
|---|---|
| cpu/limit | CPU hard limit in millicores. |
| cpu/node_capacity | Cpu capacity of a node. |
| cpu/node_allocatable | Cpu allocatable of a node. |
| cpu/node_reservation | Share of cpu that is reserved on the node allocatable. |
| cpu/node_utilization | CPU utilization as a share of node allocatable. |
| cpu/request | CPU request (the guaranteed amount of resources) in millicores. |
| cpu/usage | Cumulative CPU usage on all cores. |
| cpu/usage_rate | CPU usage on all cores in millicores. |
| filesystem/usage | Total number of bytes consumed on a filesystem. |
| filesystem/limit | The total size of filesystem in bytes. |
| filesystem/available | The number of available bytes remaining in a the filesystem |
| memory/limit | Memory hard limit in bytes. |
| memory/major_page_faults | Number of major page faults. |
| memory/major_page_faults_rate | Number of major page faults per second. |
| memory/node_capacity | Memory capacity of a node. |
| memory/node_allocatable | Memory allocatable of a node. |
| memory/node_reservation | Share of memory that is reserved on the node allocatable. |
| memory/node_utilization | Memory utilization as a share of memory allocatable. |
| memory/page_faults | Number of page faults. |
| memory/page_faults_rate | Number of page faults per second. |
| memory/request | Memory request (the guaranteed amount of resources) in bytes. |
| memory/usage | Total memory usage. |
| memory/working_set | Total working set usage. Working set is the memory being used and not easily dropped by the kernel. |
| network/rx | Cumulative number of bytes received over the network. |
| network/rx_errors | Cumulative number of errors while receiving over the network. |
| network/rx_errors_rate | Number of errors while receiving over the network per second. |
| network/rx_rate | Number of bytes received over the network per second. |
| network/tx | Cumulative number of bytes sent over the network |
| network/tx_errors | Cumulative number of errors while sending over the network |
| network/tx_errors_rate | Number of errors while sending over the network |
| network/tx_rate | Number of bytes sent over the network per second. |
| uptime | Number of milliseconds since the container was started. |
Prometheus
Prometheus集成了数据采集,存储,异常告警多项功能,是一款一体化的完整方案。 它针对大规模的集群环境设计了拉取式的数据采集方式、多维度数据存储格式以及服务发现等创新功能。
功能特点:
* 多维数据模型(有metric名称和键值对确定的时间序列)
* 灵活的查询语言
* 不依赖分布式存储
* 通过pull方式采集时间序列,通过http协议传输
* 支持通过中介网关的push时间序列的方式
* 监控数据通过服务或者静态配置来发现
* 支持多维度可视化分析和dashboard等
组件介绍:
这个生态里包含的组件,大多是可选的: * 核心prometheus server提供收集和存储时间序列数据 * 大量的client libraries来支持应用业务代码的探针 * 适用于短时任务的push gateway * 基于Rails/SQL语句的可视化分析 * 特殊用途的exporter(包括HAProxy、StatsD、Ganglia等) * 用于报警的alertmanager * 支持命令行查询的工具 * 其他工具 大多数的组件都是用Go语言来完成的,使得它们方便构建和部署。
架构图:
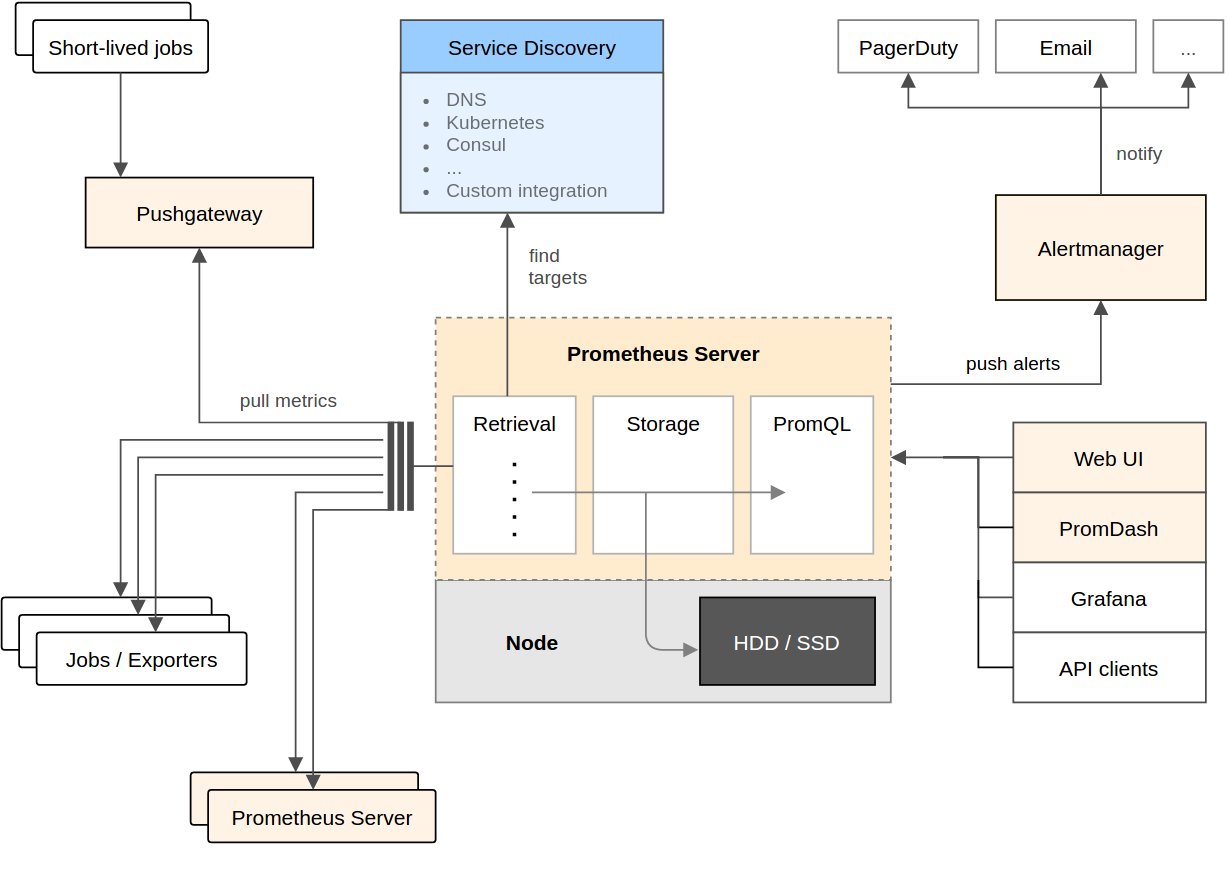
Promethues直接或通过短期Jobs的中介网关拉取收集指标。 它在本地存储所有抓取的数据样本,并对数据进行规则匹配检测,这样可以基于现有数据创建新的时间系列指标或生成警报。 PromDash或其他API使用者对收集的数据进行可视化。
引入Prometheus对k8s的影响
下图是Redhat研发人员的回答
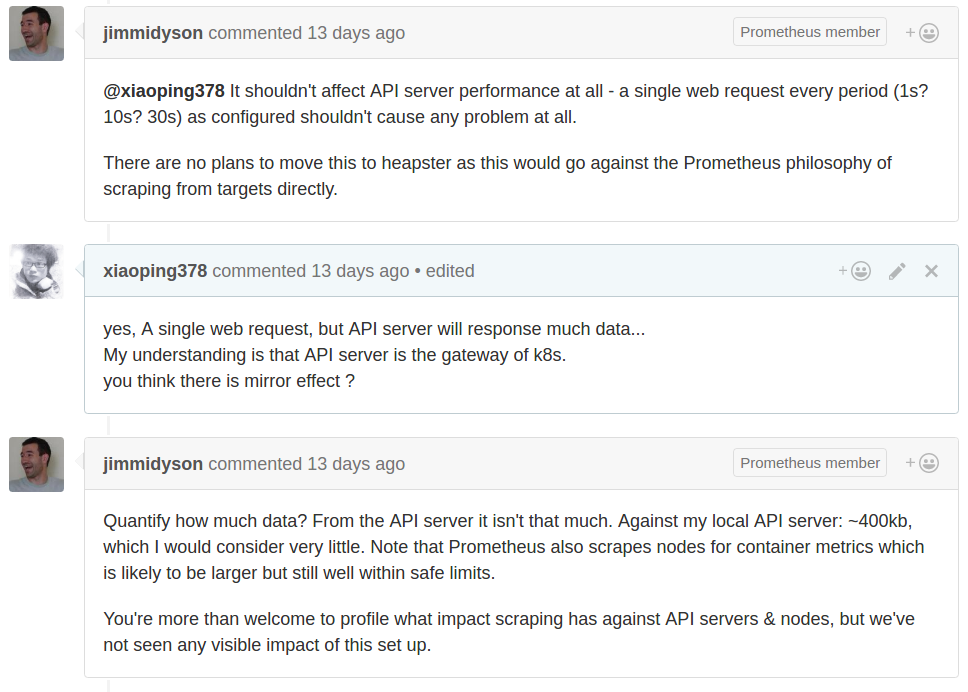
并不会对k8s产生太大的影响,其主要是通过api-server来发现需要监控的目标,然后会周期性的通过各个Node上kubelet来拉取数据。 更详细的讨论见这里
部署Prometheus
下文是基于k8s-monitor项目来说的
Prometheus is an open-source monitoring solution that includes the gathering of metrics, their storage in an internal time series database as well as querying and alerting based on that data.
It offers a lot of integrations incl. Docker, Kubernetes, etc.
Prometheus can also visualize your data. However, in this recipe we include another open-source tool, Grafana, for the visualization part, as it offers a more powerful and flexible way to generate visuals and dashboards.
If you just want to get Prometheus and Grafana up and running you can deploy the whole recipe with a single command instead of going through all steps detailed out below:
kubectl create --filename manifests/
Deploying Prometheus
First, we need to create the configuration for our Prometheus. For this we use a Config Map, which we later mount into our Prometheus pod to configure it. This way we can change the configuration without having to redeploy Prometheus itself.
kubectl create --filename manifests/prometheus-core-configmap.yaml
Then, we create a service to be able to access Prometheus.
kubectl create --filename manifests/prometheus-core-service.yaml
Finally, we can deploy Prometheus itself.
kubectl create --filename manifests/prometheus-core-deployment.yaml
Further, we need the Prometheus Node Exporter deployed to each node. For this we use a Daemon Set and a fronting service for Prometheus to be able to access the node exporters.
kubectl create --filename manifests/prometheus-node-exporter-service.yaml
kubectl create --filename manifests/prometheus-node-exporter-daemonset.yaml
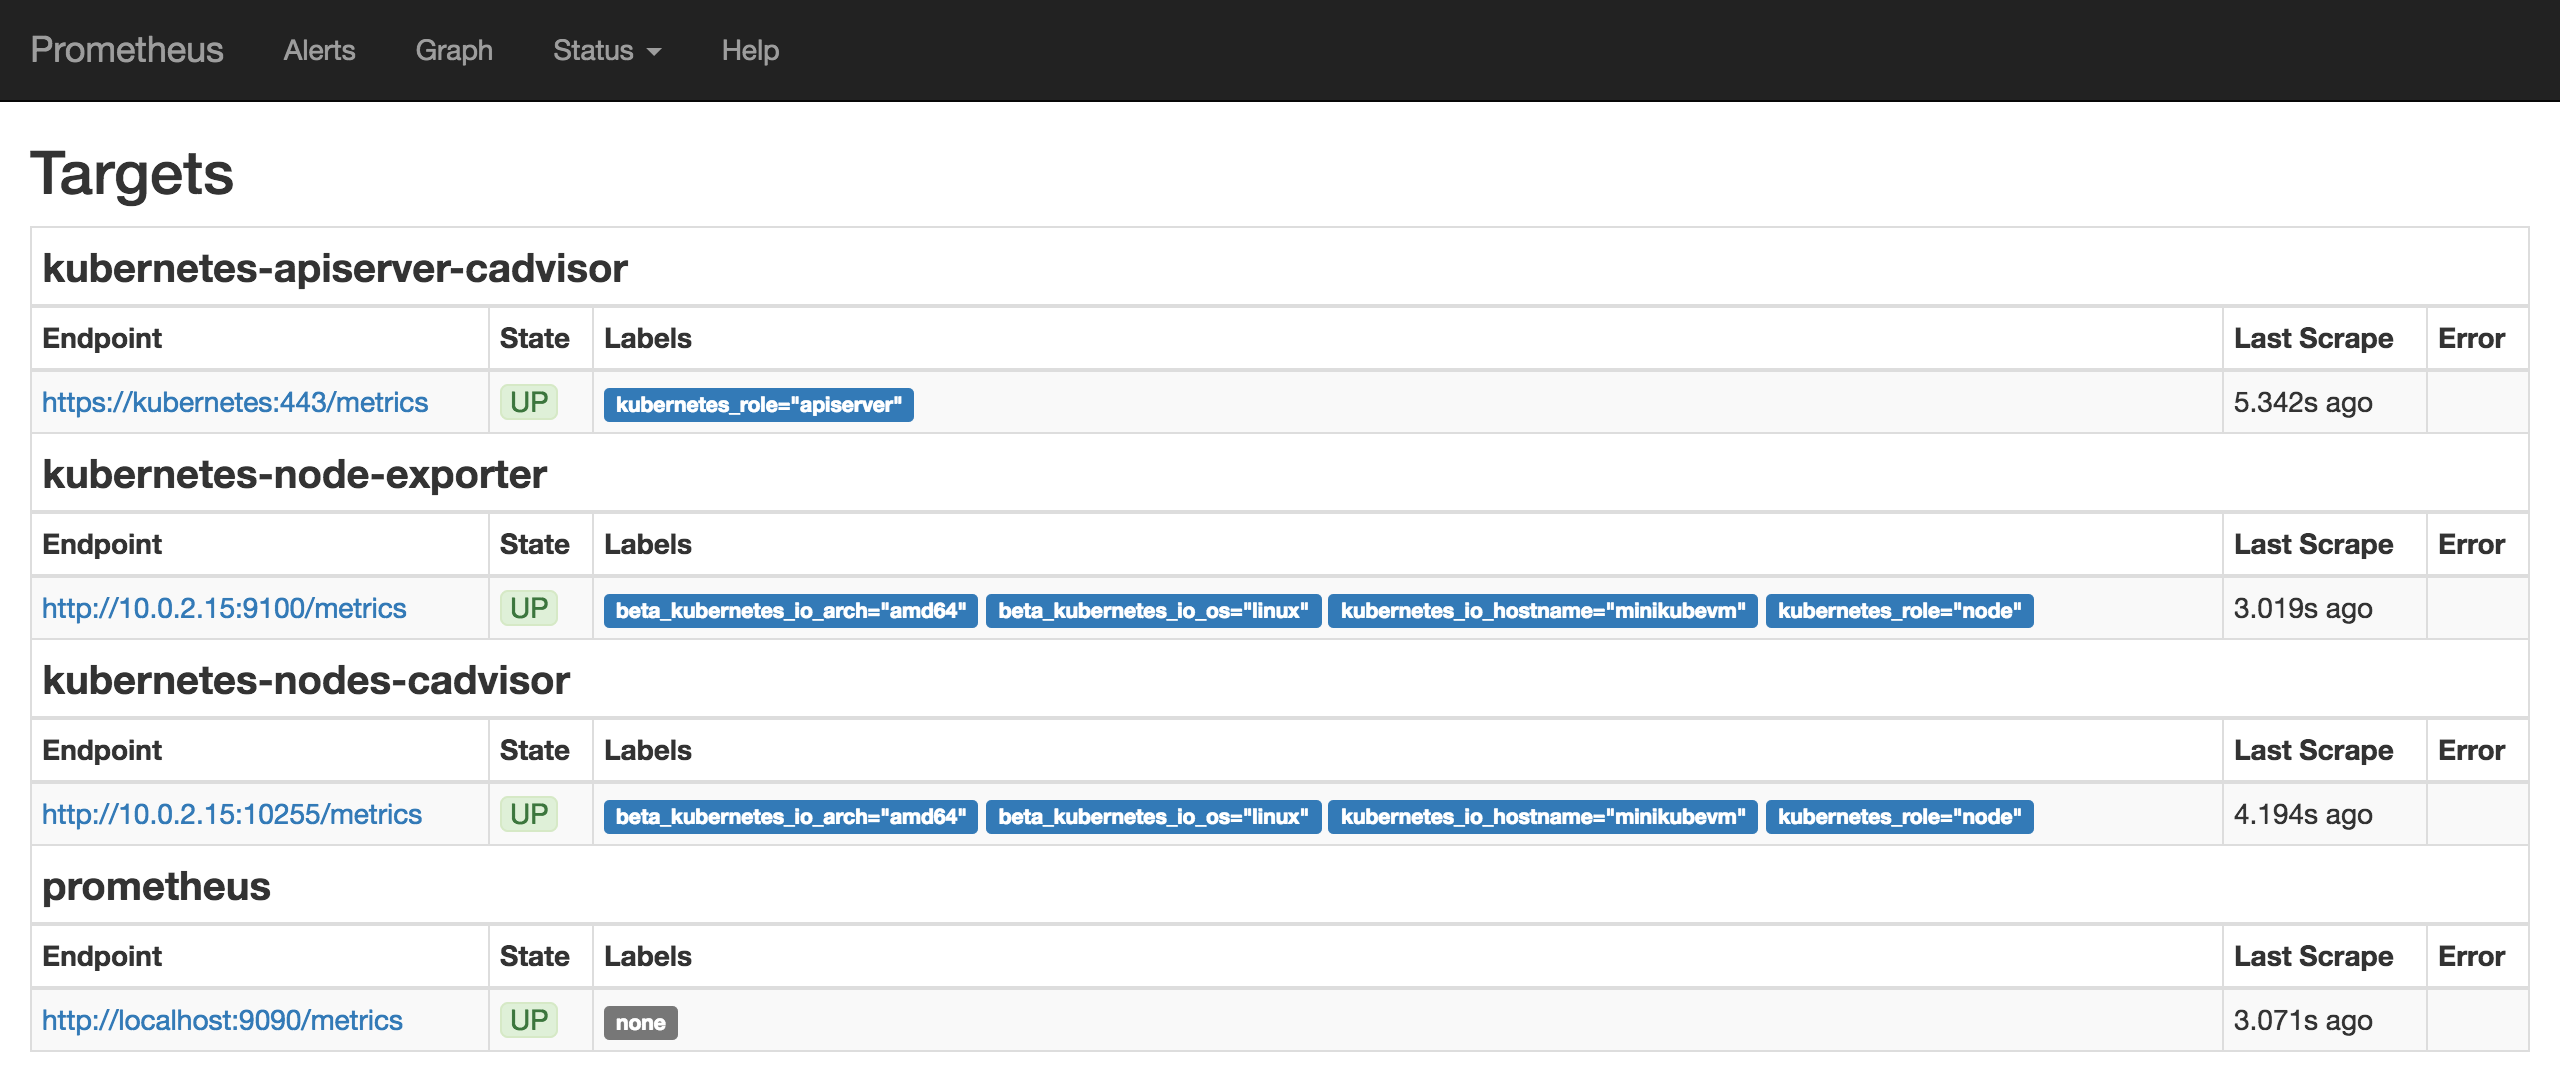
Wait a bit for all the pods to come up. Then Prometheus should be ready and running. We can check the Prometheus targets at https://mycluster.k8s.gigantic.io/api/v1/proxy/namespaces/default/services/prometheus/targets
Deploying Alertmanager
we need to create the configuration for our Alertmanager. For this we use a Config Map, which we later mount into our Alertmanager pod to configure it. This way we can change the configuration without having to redeploy Alertmanager itself.
kubectl create --filename manifests/prometheus-alert-configmap.yaml
Then, we create a service to be able to access Alertmanager.
kubectl create --filename manifests/prometheus-alert-service.yaml
Finally, we can deploy Alertmanager itself.
kubectl create --filename manifests/prometheus-alert-deployment.yaml
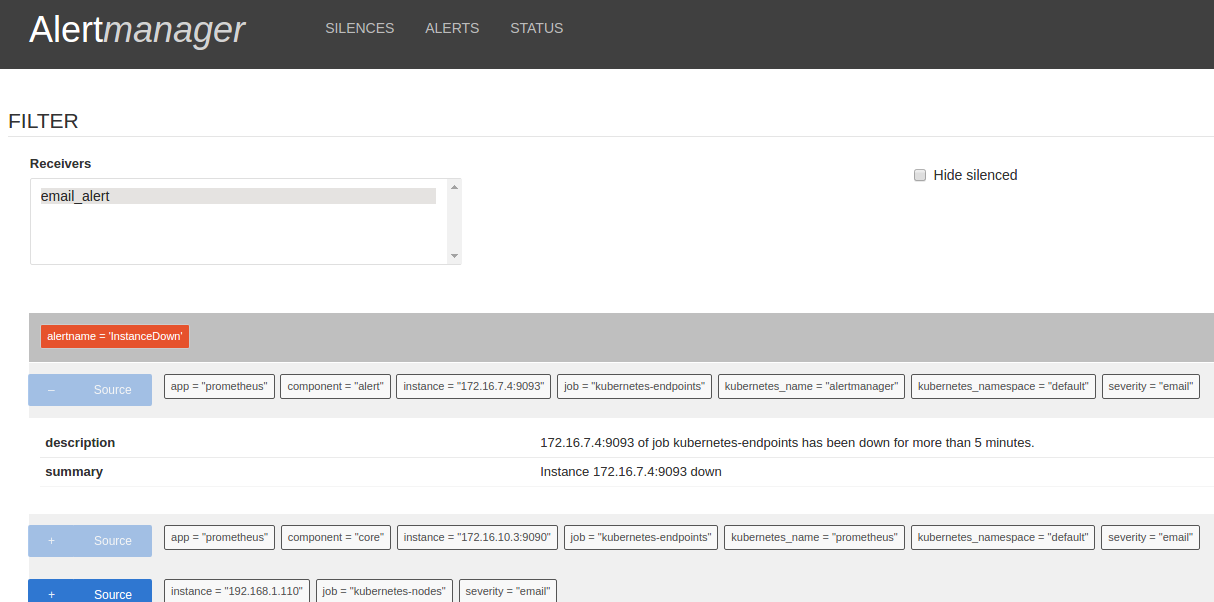
Wait a bit for all the pods to come up. Then Alertmanager should be ready and running. We can check the Alertmanager targets at https://mycluster.k8s.gigantic.io/api/v1/proxy/namespaces/default/services/alertmanager/
Deploying Grafana
Now that we have Prometheus up and running we can deploy Grafana to have a nicer frontend for our metrics.
Again, we create a service to be able to access Grafana and a deployment to manage the pods.
kubectl create --filename manifests/grafana-services.yaml
kubectl create --filename manifests/grafana-deployment.yaml
Wait a bit for Grafana to come up. Then you can access Grafana at https://mycluster.k8s.gigantic.io/api/v1/proxy/namespaces/default/services/grafana/
Setting Up Grafana
TLDR: If you don't want to go through all the manual steps below you can let the following job use the API to configure Grafana to a similar state.
kubectl create --filename manifests/grafana-import-dashboards-job.yaml
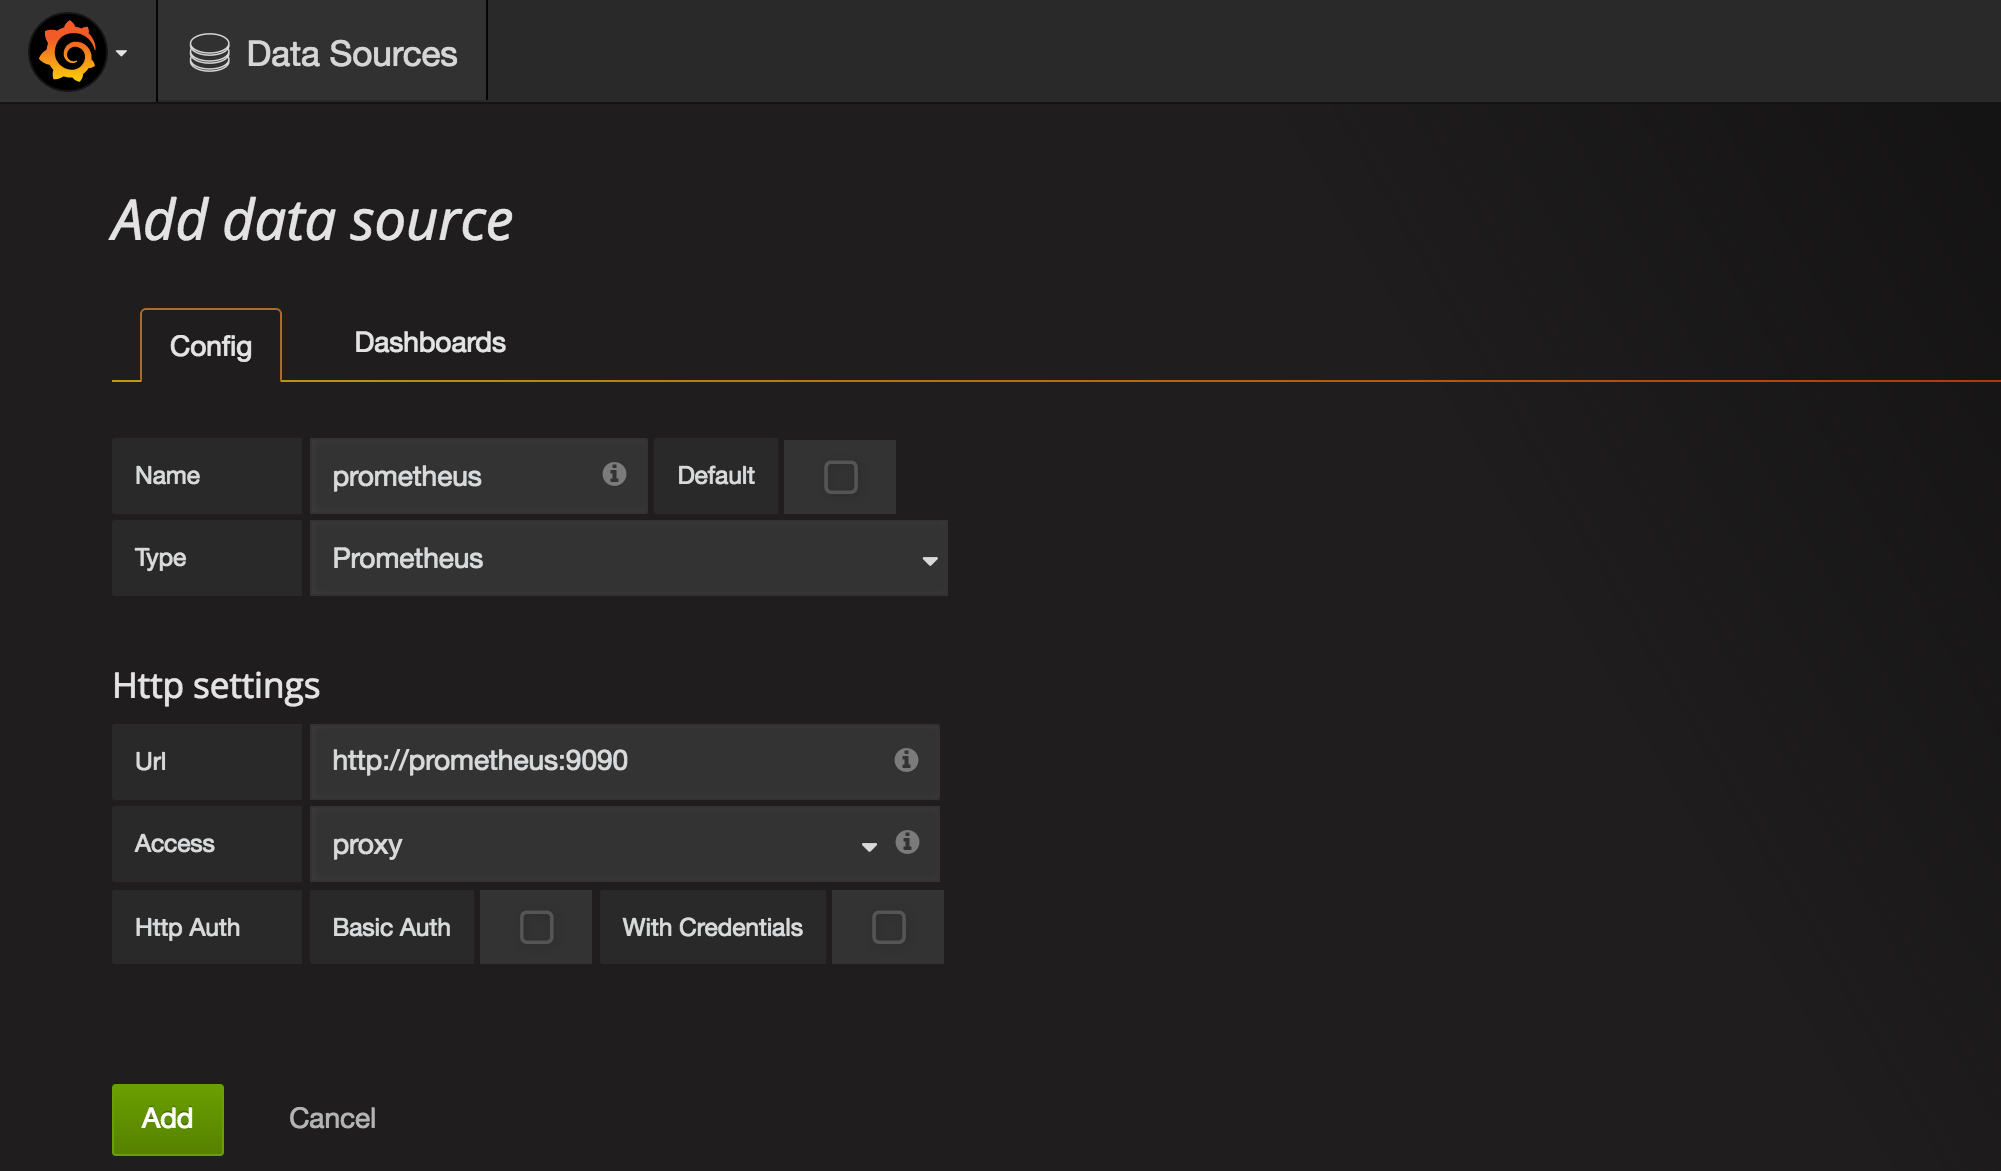
Once we're in Grafana we need to first configure Prometheus as a data source.
Grafana UI / Data Sources / Add data sourceName:prometheusType:PrometheusUrl:http://prometheus:9090Add
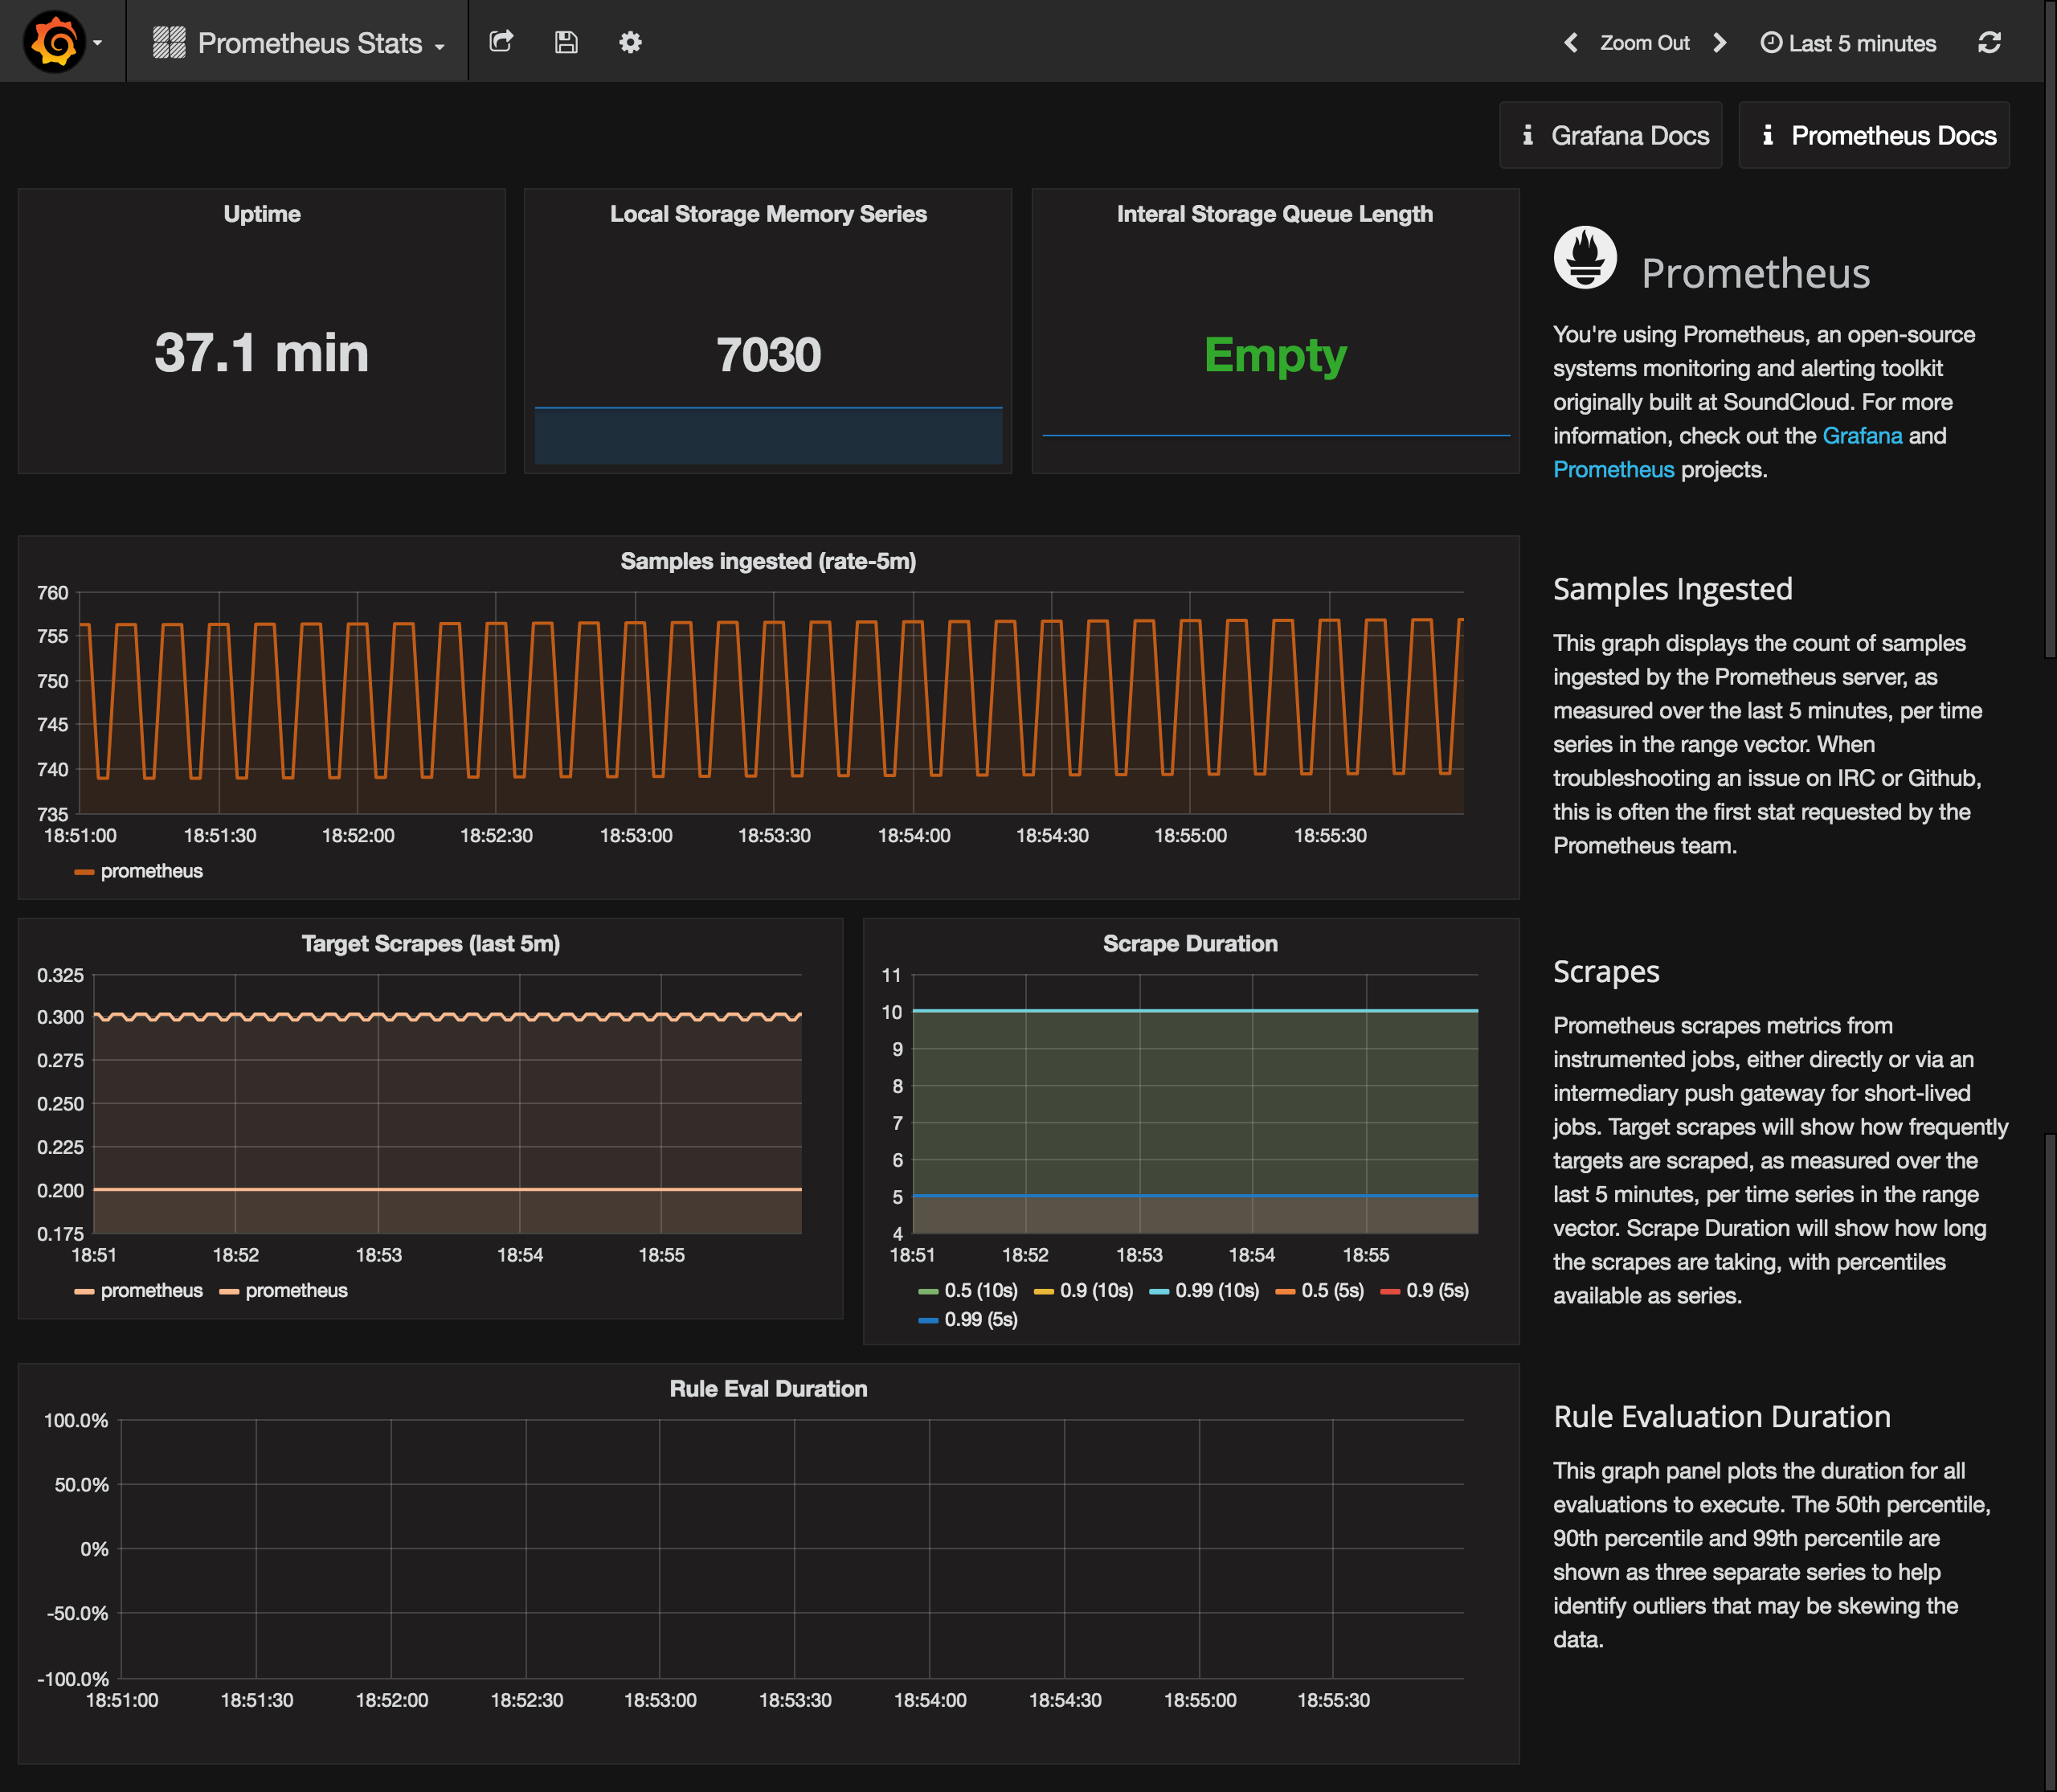
Then go to the Dashboards tab and import the Prometheus Stats dashboard, which shows the status of Prometheus itself.
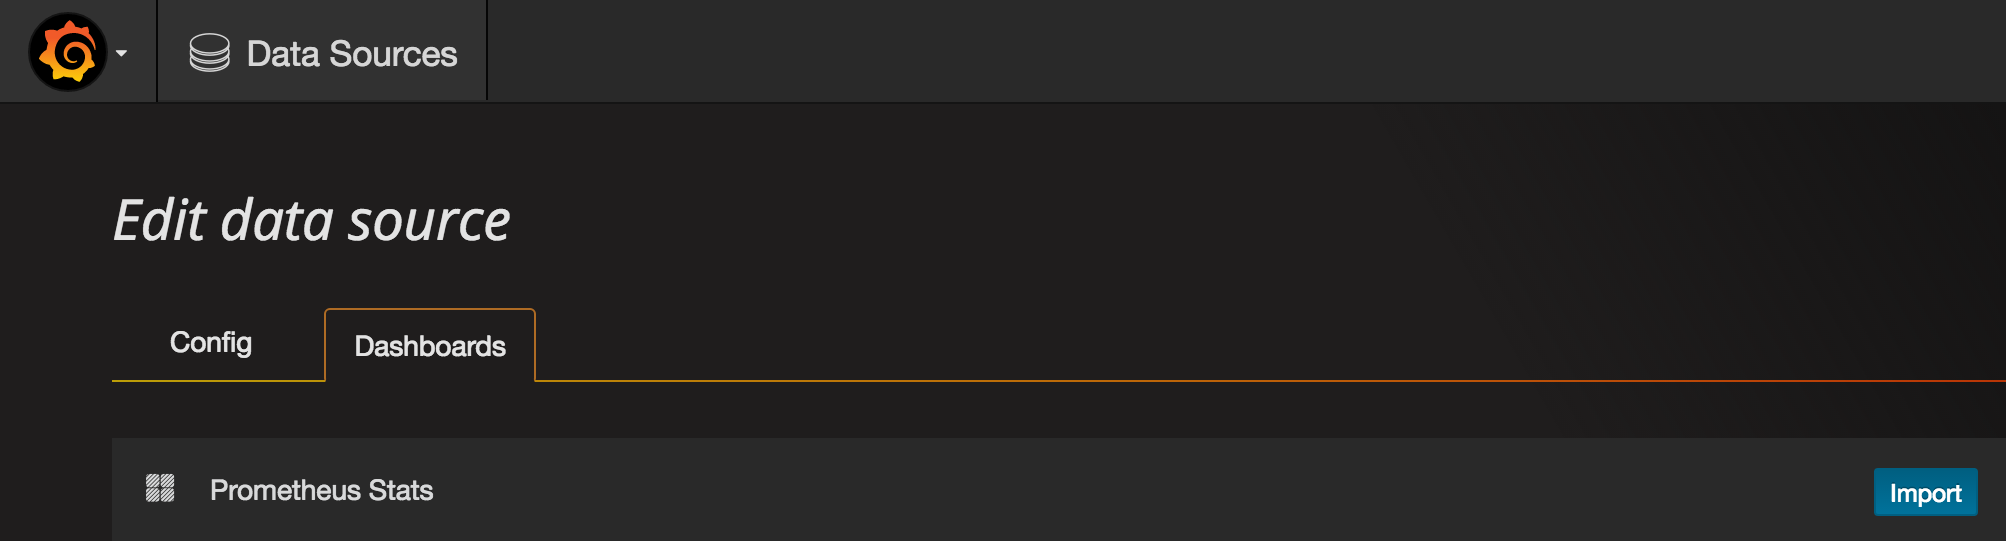
You can check it out to see how your Prometheus is doing.
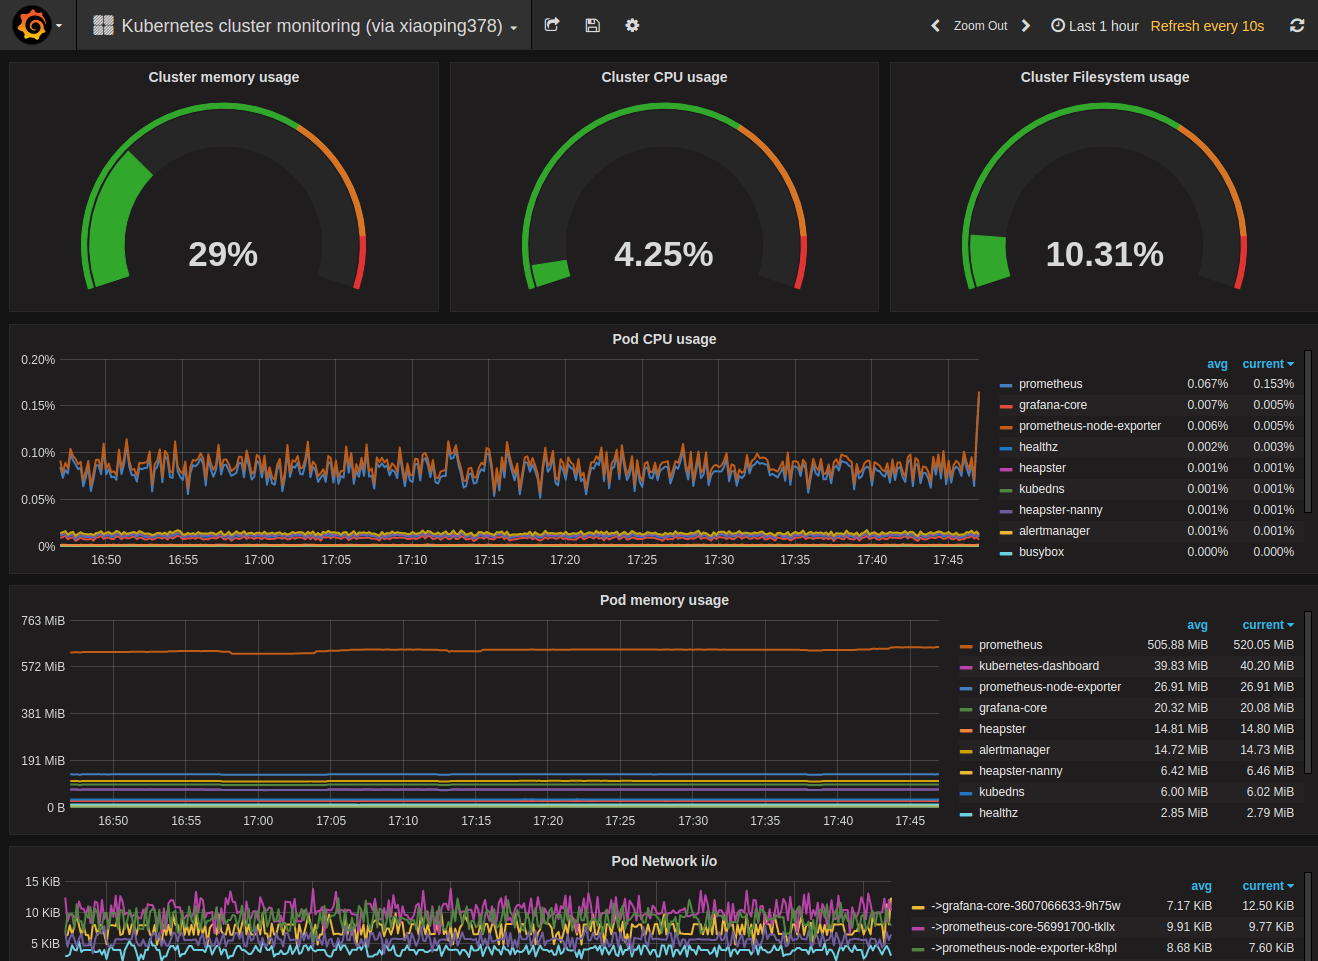
Last, but not least we can import a sample Kubernetes cluster monitoring dashboard, to get a first overview over our cluster metrics.
Grafana UI / Dashboards / ImportGrafana.net Dashboard:https://grafana.net/dashboards/597LoadPrometheus:prometheusSave & Open
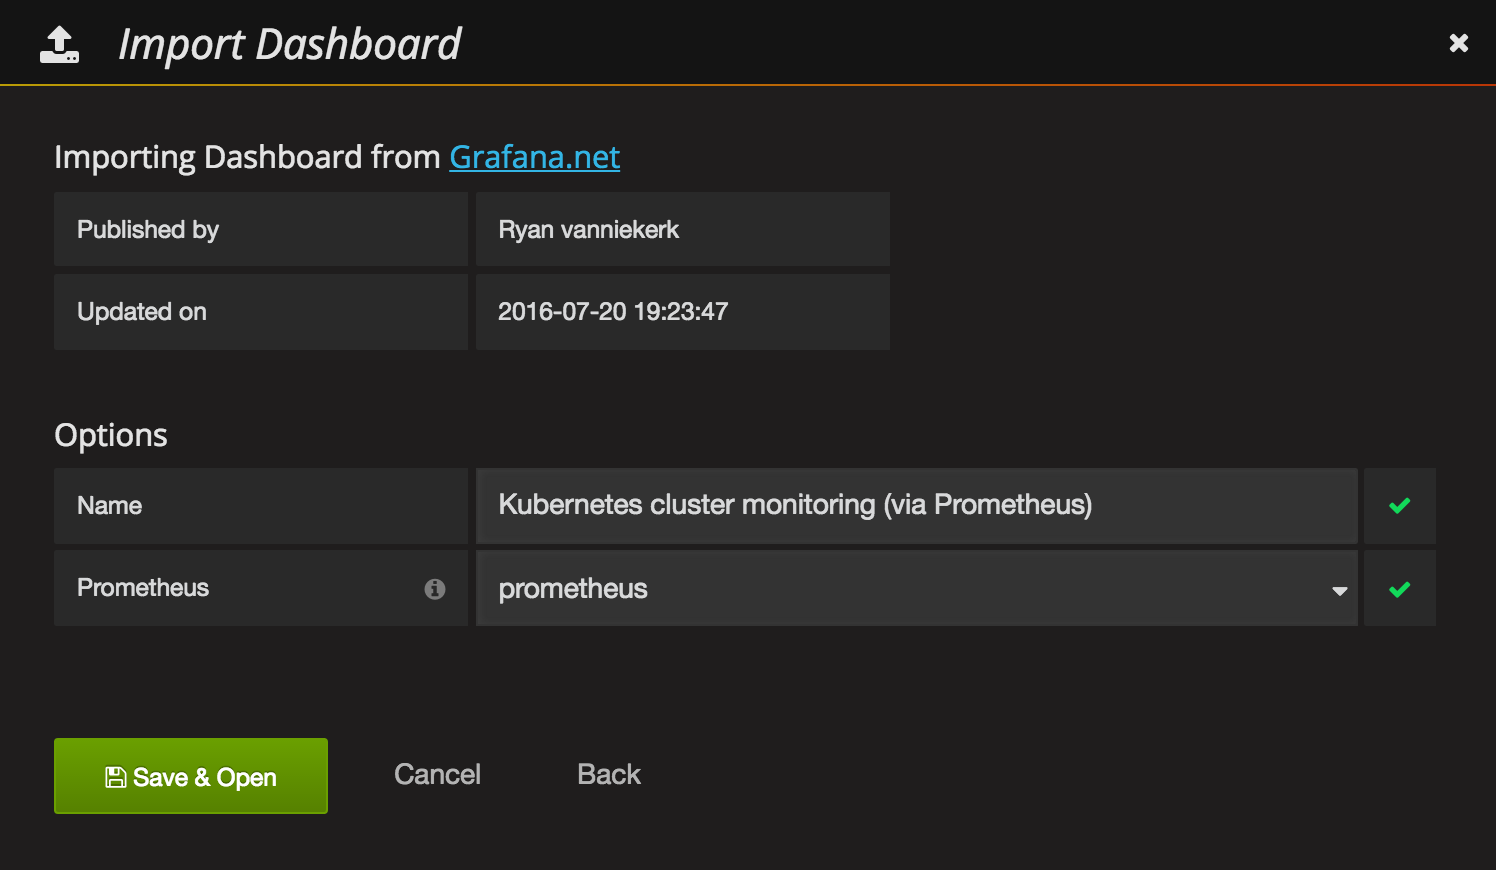
Voilá. You have a nice first dashboard with metrics of your Kubernetes cluster.
Next Steps
Next, you should get into the Grafana and Prometheus documentations to get to know the tools and either build your own dashboards or extend the samples from above.
You can also check out grafana.net for some more example dashboards and plugins.
More Alertmanager documentations in here