主要介绍k8s的核心功能和周边生态
Kubernetes
俗称k8s,在往容器云PaaS平台方向演进。
- 1: 源码部署K8S
- 2: 离线安装kubernetes
- 3: k8s的各组件和特性扫盲
- 4: Helm模板介绍
- 5: k8s的监控方案
- 6: 配置harbor默认https访问
- 7: DEIS 开源PAAS平台实践
- 8: k3s实践-01
- 9: kubeshere 自研-01
- 10: TKEStack all-in-one入坑指南
1 - 源码部署K8S
基于源码本地运行k8s集群
此文应该不能运行成功了,,,陈年老文,有待验证。
一. 先介绍最省事的部署方法,直接从官网下release版本安装:
git clone 代码步骤省略 ...
- 下载各依赖的release版本
通过修改配置文件 cluster/centos/config-build.sh, 可自定义(k8s, docker, flannel, etcd)各自的下载地址和版本, 不同的版本的依赖可能会需要小改下脚本(版本变更有些打包路径发生了变化,兼容性问题)
cd cluster/centos && ./build.sh all
- 安装并启动k8s集群环境
通过修改配置文件 cluster/centos/config-default.sh,定义你环境里的设备的IP和其他参数,推荐运行脚本前先通过ssh-copy-id做好免密钥认证;
export KUBERNETES_PROVIDER=centos && cluster/kube-up.sh
二. 源码级编译安装
本步骤基于上一大步来说, 先来看下载各依赖的release后,cluster/centos下目录发生了什么变化
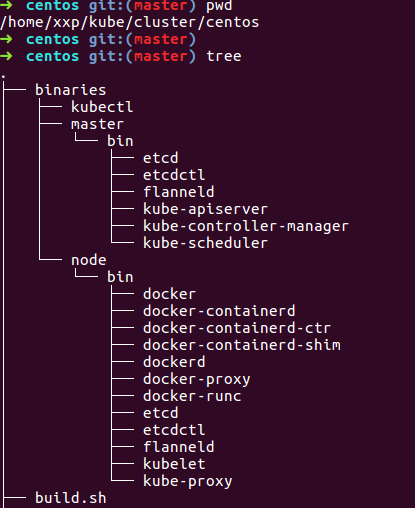
多了一个binaries的目录,里面是各master和minion上各依赖的二进制文件, 所以我们只要源码编译的结果,替换到这里来, 然后继续上一大步的第2小步即可。
这里说下,本地编译k8s的话,需要设置安装godep,然后命令本地化。
export PATH=$PATH:$GOPATH/bin
最后只需要去源码根目录下执行, 编译结果在_output目录下
make
替换到相应的binaries目录下,重新运行kube-up.sh即可。
2 - 离线安装kubernetes
介绍离线安装k8s 1.5版本
虽然距离当前主流版本已经差之千里,但其中的思想仍记得借鉴。
经常遇到全新初始安装k8s集群的问题,所以想着搞成离线模式,本着最小依赖原则,提高安装速度
基于Centos7-1511-minimal, 非此版本脚本应该会运行出错,自行修改吧
本离线安装所有的依赖都打包放到了百度网盘
为了便于维护,已建立独立项目k8s-deploy
第一步
基本思路是,在k8s-deploy目录下,临时启个http server, node节点上会从此拉取所依赖镜像和rpms
# python -m SimpleHTTPServer
Serving HTTP on 0.0.0.0 port 8000 ...
windows上可以用hfs临时启个http server, 自行百度如何使用
master侧
运行以下命令,初始化master
192.168.56.1:8000 是我的http-server, 注意要将k8s-deploy.sh 里的HTTP-SERVER变量也改下
curl -L http://192.168.56.1:8000/k8s-deploy.sh | bash -s master
minion侧
视自己的情况而定
curl -L http://192.168.56.1:8000/k8s-deploy.sh | bash -s join --token=6669b1.81f129bc847154f9 192.168.56.100
总结
整个脚本实现比较简单, 坑都在脚本里解决了。脚本文件在这里
就一个master-up和node-up, 基本一个函数只做一件事,很清晰,可以自己查看具体过程。
1.5 与 1.3给我感觉最大的变化是网络部分, 1.5启用了cni网络插件 不需要像以前一样非要把flannel和docker绑在一起了(先启flannel才能启docker)。
具体可以看这里 https://github.com/containernetworking/cni/blob/master/Documentation/flannel.md
master侧如果是单核的话,会因资源不足, dns安装失败。
3 - k8s的各组件和特性扫盲
主要介绍k8s中的各核心组件和特性
了解一个工具的特性可以从它的参数入手
api-server
在k8s内发挥的网关和api
CSR特性
网络
flannel
-
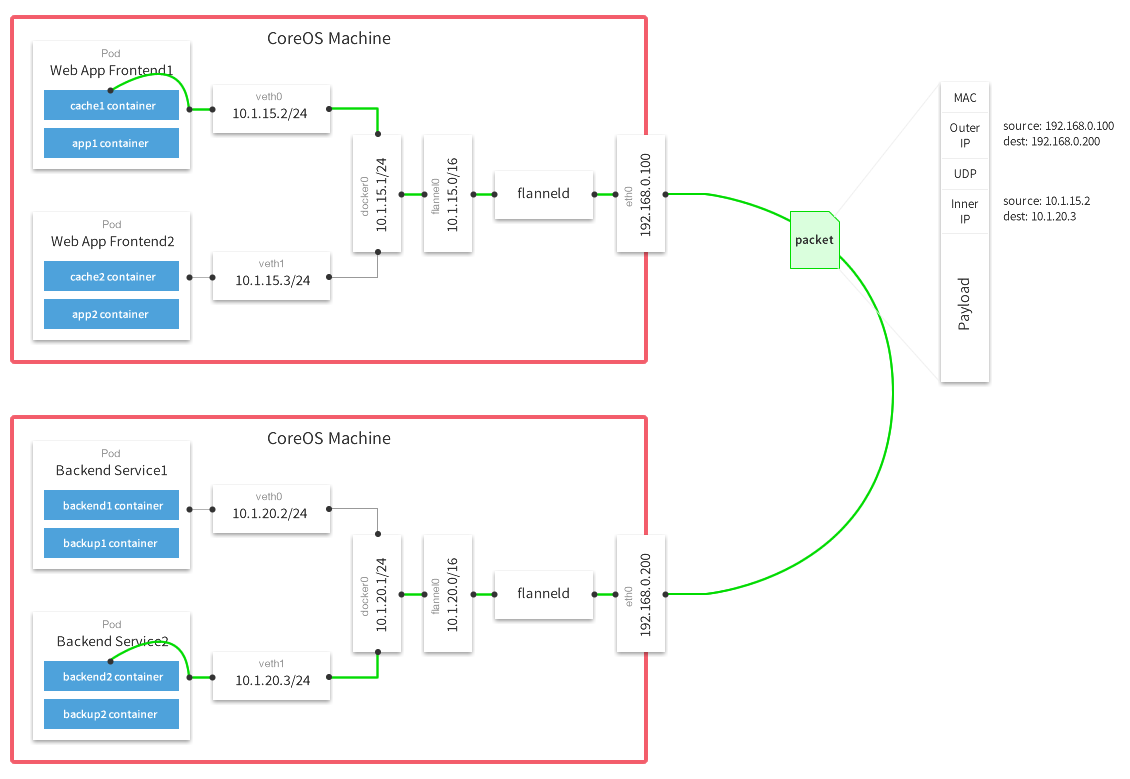
flannel的设计就是为集群中所有节点能重新规划IP地址的使用规则,从而使得不同节点上的容器能够获得“同属一个内网”且”不重复的”IP地址, 并让属于不同节点上的容器能够直接通过内网IP通信。
-
实际上就是给每个节点的docker重新设置容器上可分配的IP段,
--bip的妙用。 这恰好迎合了k8s的设计,即一个pod(container)在集群中拥有唯一、可路由到的IP,带来的好处就是减少跨主机容器间通信要port mapping的复杂性。 -
原理
- flannle需要运行一个叫flanned的agent,其用etcd来存储网络配置、已经分配的子网、和辅助信息(主机IP),如下
[root@master1 ~]# etcdctl ls /coreos.com/network /coreos.com/network/config /coreos.com/network/subnets [root@master1 ~]# [root@master1 ~]# etcdctl get /coreos.com/network/config {"Network":"172.16.0.0/16"} [root@master1 ~]# [root@master1 ~]# etcdctl ls /coreos.com/network/subnets /coreos.com/network/subnets/172.16.29.0-24 /coreos.com/network/subnets/172.16.40.0-24 /coreos.com/network/subnets/172.16.60.0-24 [root@master1 ~]# [root@master1 ~]# etcdctl get /coreos.com/network/subnets/172.16.29.0-24 {"PublicIP":"192.168.1.129"}-
flannel0 还负责解封装报文,或者创建路由。 flannel有多种方式可以完成报文的转发。
- UDP
- vxlan
- host-gw
- aws-vpc
- gce
- alloc
下图是经典的UDP封装方式数据流图
4 - Helm模板介绍
主要介绍k8s生态中应用打包的工具helm
概要
-
Helm是一个管理kubernetes集群内应用的工具,提供了一系列管理应用的快捷方式,例如 inspect, install, upgrade, delete等,经验可以沿用以前apt,yum,homebrew的,区别就是helm管理的是kubernetes集群内的应用。
-
还有一个概念必须得提,就是
chart, 它代表的就是被helm管理的应用包,里面具体就是放一些预先配置的Kubernetes资源(pod, rc, deployment, service, ingress),一个包描述文件(Chart.yaml), 还可以通过指定依赖来组织成更复杂的应用,支持go template语法,可参数化模板,让使用者定制化安装 charts可以存放在本地,也可以放在远端,这点理解成yum仓很合适。。。
这里有个应用市场 ,里面罗列了各种应用charts。由开源项目monocular支撑
下面主要介绍helm的基本使用流程和具体场景的实践。
初始化k8s集群v1.6.2
先来准备k8s环境,可以通过k8s-deploy项目来离线安装高可用kubernetes集群,我这里是单机演示环境。
kubeadm init --kubernetes-version v1.6.2 --pod-network-cidr 12.240.0.0/12

#方便命令自动补全
source <(kubectl completion zsh)

#安装cni网络
cp /etc/kubernetes/admin.conf $HOME/.kube/config
kubectl apply -f kube-flannel-rbac.yml
kubectl apply -f kube-flannel.yml

#使能master可以被调度
kubectl taint node --all  node-role.kubernetes.io/master-

#安装ingress-controller, 边界路由作用
kubectl create -f ingress-traefik-rbac.yml
kubectl create -f ingress-traefik-deploy.yml
这样一个比较完整的k8s环境就具备了,另外监控和日志不在此文的讨论范围内。
初始化Helm环境
由于刚才创建的k8s集群默认启用RBAC机制,个人认为这个特性是k8s真正走向成熟的一大标志,废话不表,为了helm可以安装任何应用,我们先给他最高权限。
kubectl create serviceaccount helm --namespace kube-system
kubectl create clusterrolebinding cluster-admin-helm --clusterrole=cluster-admin --serviceaccount=kube-system:helm
初始化helm,如下执行,会在kube-system namepsace里安装一个tiller服务端,这个服务端就是用来解析helm语义的,后台再转成api-server的API执行:
➜  helm init --service-account helm
$HELM_HOME has been configured at /home/xxp/.helm.
Tiller (the helm server side component) has been installed into your Kubernetes Cluster.
Happy Helming!

➜  helm version
Client: &version.Version{SemVer:"v2.4.1", GitCommit:"46d9ea82e2c925186e1fc620a8320ce1314cbb02", GitTreeState:"clean"}
Server: &version.Version{SemVer:"v2.4.1", GitCommit:"46d9ea82e2c925186e1fc620a8320ce1314cbb02", GitTreeState:"clean"}

#命令行补全
➜  source <(helm completion zsh)
安装第一个应用
初始化Helm后,默认就导入了2个repos,后面安装和搜索应用时,都是从这2个仓里出的,当然也可以自己通过helm repo add添加本地私有仓
➜  helm repo list
NAME  URL
stable	https://kubernetes-charts.storage.googleapis.com
local http://127.0.0.1:8879/charts
其实上面的repo仓的索引信息是存放在~/.helm/repository的, 类似/etc/yum.repos.d/的作用
helm的使用基本流程如下:
- helm search: 搜索自己想要安装的应用(chart)
- helm fetch: 下载应用(chart)到本地,可以忽略此步
- helm install: 安装应用
- helm ls: 查看已安装的应用情况
这里举例安装redis
➜ helm install stable/redis --set persistence.enabled=false
如上,如果网络给力的话,很快就会装上最新的redis版本,Helm安装应用,目前有四种方式:
helm install stable/mariadb通过chart仓来安装helm install ./nginx-1.2.3.tgz通过本地打包后的压缩chart包来安装helm install ./nginx通过本地的chart目录来安装helm install https://example.com/charts/nginx-1.2.3.tgz通过绝对网络地址来安装chart压缩包
实战演示
主要从制作自己的chart, 构建自己的repo, 组装复杂应用的实战三方面来演示
制作自己的chart
helm有一个很好的引导教程模板, 如下会自动创建一个通用的应用模板
➜  helm create myapp
Creating myapp

➜  tree myapp
myapp
├── charts  //此应用包的依赖包定义(如果有的话,也会是类似此包的目录结构)
├── Chart.yaml  // 包的描述文件
├── templates  // 包的主体目录
│   ├── deployment.yaml  // kubernetes里的deployment yaml文件
│   ├── _helpers.tpl  // 模板里如果复杂的话,可能需要函数或者其他数据结构,这里就是定义的地方
│   ├── ingress.yaml // kubernetes里的ingress yaml文件
│   ├── NOTES.txt // 想提供给使用者的一些注意事项,一般提供install后,如何访问之类的信息
│   └── service.yaml // kubernetes里的service yaml文件
└── values.yaml // 参数的默认值

2 directories, 7 files
如上操作,我们就有了一个myapp的应用,目录结构如上,来看看看values.yaml的内容, 这个里面就是模板里可定制参数的默认值
很容易看到,kubernetes里的rc实例数,镜像名,servie配置,路由ingress配置都可以轻松定制。
# Default values for myapp.
# This is a YAML-formatted file.
# Declare variables to be passed into your templates.
replicaCount: 1
image:
  repository: nginx
  tag: stable
  pullPolicy: IfNotPresent
service:
  name: nginx
  type: ClusterIP
  externalPort: 80
  internalPort: 80
ingress:
  enabled: false
  # Used to create Ingress record (should used with service.type: ClusterIP).
  hosts:
    - chart-example.local
  annotations:
    # kubernetes.io/ingress.class: nginx
    # kubernetes.io/tls-acme: "true"
  tls:
    # Secrets must be manually created in the namespace.
    # - secretName: chart-example-tls
    #   hosts:
    #     - chart-example.local
resources:
  limits:
    cpu: 100m
    memory: 128Mi
  requests:
    cpu: 100m
    memory: 128Mi
note.
一般拿到一个现有的app chart后,这个文件是必看的,通过
helm fetch myapp会得到一个类似上面目录的压缩包
我们可以通过 --set或传入values.yaml文件来定制化安装,
# 安装myapp模板: 启动2个实例,并可通过ingress对外提供myapp.192.168.31.49.xip.io的域名访问
➜  helm install --name myapp --set replicaCount=2,ingress.enabled=true,ingress.hosts={myapp.192.168.31.49.xip.io} ./myapp

➜  helm ls
NAME                  	REVISION	UPDATED                 	STATUS  	CHART      	NAMESPACE
exasperated-rottweiler	1       	Wed May 10 13:58:56 2017	DEPLOYED	redis-0.5.2	default
myapp                 	1       	Wed May 10 21:46:51 2017	DEPLOYED	myapp-0.1.0	default

#通过传入yml文件来安装
#helm install --name myapp -f myvalues.yaml ./myapp
构建私有charts repo
通过 helm repo list, 得知默认的local repo地址是http://127.0.0.1:8879/charts, 可以简单的通过helm serve来操作,再或者自己起个web server也是一样的。
这里举例,把刚才创建的myapp放到本地仓里
➜  helm search myapp
No results found
➜
➜  source <(helm completion zsh)
➜
➜  helm package myapp
➜
➜  helm serve &
[1] 10619
➜  Regenerating index. This may take a moment.
Now serving you on 127.0.0.1:8879

➜  deis helm search myapp
NAME       	VERSION	DESCRIPTION
local/myapp	0.1.0  	A Helm chart for Kubernetes
目前个人感觉体验不太好的是,私有仓里的app必须以tar包的形式存在。
构建复杂应用
透过例子学习,会加速理解,我们从deis里的workflow应用来介绍
➜  ~ helm repo add deis https://charts.deis.com/workflow
"deis" has been added to your repositories
➜  ~
➜  ~ helm search workflow
NAME         	VERSION	DESCRIPTION
deis/workflow	v2.14.0	Deis Workflow
➜  ~
➜  ~ helm fetch deis/workflow --untar
➜  ~ helm dep list workflow
NAME                    	VERSION	REPOSITORY                                      	STATUS
builder                 	v2.10.1	https://charts.deis.com/builder                 	unpacked
slugbuilder             	v2.4.12	https://charts.deis.com/slugbuilder             	unpacked
dockerbuilder           	v2.7.2 	https://charts.deis.com/dockerbuilder           	unpacked
controller              	v2.14.0	https://charts.deis.com/controller              	unpacked
slugrunner              	v2.3.0 	https://charts.deis.com/slugrunner              	unpacked
database                	v2.5.3 	https://charts.deis.com/database                	unpacked
fluentd                 	v2.9.0 	https://charts.deis.com/fluentd                 	unpacked
redis                   	v2.2.6 	https://charts.deis.com/redis                   	unpacked
logger                  	v2.4.3 	https://charts.deis.com/logger                  	unpacked
minio                   	v2.3.5 	https://charts.deis.com/minio                   	unpacked
monitor                 	v2.9.0 	https://charts.deis.com/monitor                 	unpacked
nsqd                    	v2.2.7 	https://charts.deis.com/nsqd                    	unpacked
registry                	v2.4.0 	https://charts.deis.com/registry                	unpacked
registry-proxy          	v1.3.0 	https://charts.deis.com/registry-proxy          	unpacked
registry-token-refresher	v1.1.2 	https://charts.deis.com/registry-token-refresher	unpacked
router                  	v2.12.1	https://charts.deis.com/router                  	unpacked
workflow-manager        	v2.5.0 	https://charts.deis.com/workflow-manager        	unpacked

➜  ~ ls workflow
charts  Chart.yaml  requirements.lock  requirements.yaml  templates  values.yaml
如上操作,我们会得到一个巨型应用,实际上便是deis出品的workflow开源paas平台,具体这个平台的介绍下次有机会再分享
整个大型应用是通过 wofkflow/requirements.yaml组织起来的,所有依赖的chart放到charts目录,然后charts目录里就是些类似myapp的小应用
更复杂的应用,甚至有人把openstack用helm安装到Kubernetes上,感兴趣的可以参考这里
5 - k8s的监控方案
主要介绍k8s生态中的监控方案
方案选型
如果已存在完善的监控系统的话,推荐使用k8s原生的heapster,比较轻量,容易集成。
我选择的是prometheus, 它是比较完善的云平台级监控方案,继k8s之后同样已被列入云计算基金会项目, 除了具备heapster的能力之外,还支持监控广泛的应用(mysql, JMX, HAProxy等)和灵活的告警的能力,并具备多IDC federation的能力,兼容多种开源监控系统(StatsD, Ganglia, collectd, nagios等)。
本文主要参考
下面分别介绍下两种方案
heapster
-
heapster的介绍:
通过向kubelet拉取stats的方式, 可提供15分钟内的缓存供k8s的dashboard用,也支持第三方存储,如influxdb等,还具备REST API(经我实验,这个API还不完善 缺少diskIO API).
-
heapster的监控范围
可监控的内容包括集群内的Container, Pod, Node 和 Namespace的性能或配置信息, 目前container级别还不支持网络和硬盘信息,具体性能项如下
| Metric Name | Description |
|---|---|
| cpu/limit | CPU hard limit in millicores. |
| cpu/node_capacity | Cpu capacity of a node. |
| cpu/node_allocatable | Cpu allocatable of a node. |
| cpu/node_reservation | Share of cpu that is reserved on the node allocatable. |
| cpu/node_utilization | CPU utilization as a share of node allocatable. |
| cpu/request | CPU request (the guaranteed amount of resources) in millicores. |
| cpu/usage | Cumulative CPU usage on all cores. |
| cpu/usage_rate | CPU usage on all cores in millicores. |
| filesystem/usage | Total number of bytes consumed on a filesystem. |
| filesystem/limit | The total size of filesystem in bytes. |
| filesystem/available | The number of available bytes remaining in a the filesystem |
| memory/limit | Memory hard limit in bytes. |
| memory/major_page_faults | Number of major page faults. |
| memory/major_page_faults_rate | Number of major page faults per second. |
| memory/node_capacity | Memory capacity of a node. |
| memory/node_allocatable | Memory allocatable of a node. |
| memory/node_reservation | Share of memory that is reserved on the node allocatable. |
| memory/node_utilization | Memory utilization as a share of memory allocatable. |
| memory/page_faults | Number of page faults. |
| memory/page_faults_rate | Number of page faults per second. |
| memory/request | Memory request (the guaranteed amount of resources) in bytes. |
| memory/usage | Total memory usage. |
| memory/working_set | Total working set usage. Working set is the memory being used and not easily dropped by the kernel. |
| network/rx | Cumulative number of bytes received over the network. |
| network/rx_errors | Cumulative number of errors while receiving over the network. |
| network/rx_errors_rate | Number of errors while receiving over the network per second. |
| network/rx_rate | Number of bytes received over the network per second. |
| network/tx | Cumulative number of bytes sent over the network |
| network/tx_errors | Cumulative number of errors while sending over the network |
| network/tx_errors_rate | Number of errors while sending over the network |
| network/tx_rate | Number of bytes sent over the network per second. |
| uptime | Number of milliseconds since the container was started. |
Prometheus
Prometheus集成了数据采集,存储,异常告警多项功能,是一款一体化的完整方案。 它针对大规模的集群环境设计了拉取式的数据采集方式、多维度数据存储格式以及服务发现等创新功能。
功能特点:
* 多维数据模型(有metric名称和键值对确定的时间序列)
* 灵活的查询语言
* 不依赖分布式存储
* 通过pull方式采集时间序列,通过http协议传输
* 支持通过中介网关的push时间序列的方式
* 监控数据通过服务或者静态配置来发现
* 支持多维度可视化分析和dashboard等
组件介绍:
这个生态里包含的组件,大多是可选的: * 核心prometheus server提供收集和存储时间序列数据 * 大量的client libraries来支持应用业务代码的探针 * 适用于短时任务的push gateway * 基于Rails/SQL语句的可视化分析 * 特殊用途的exporter(包括HAProxy、StatsD、Ganglia等) * 用于报警的alertmanager * 支持命令行查询的工具 * 其他工具 大多数的组件都是用Go语言来完成的,使得它们方便构建和部署。
架构图:
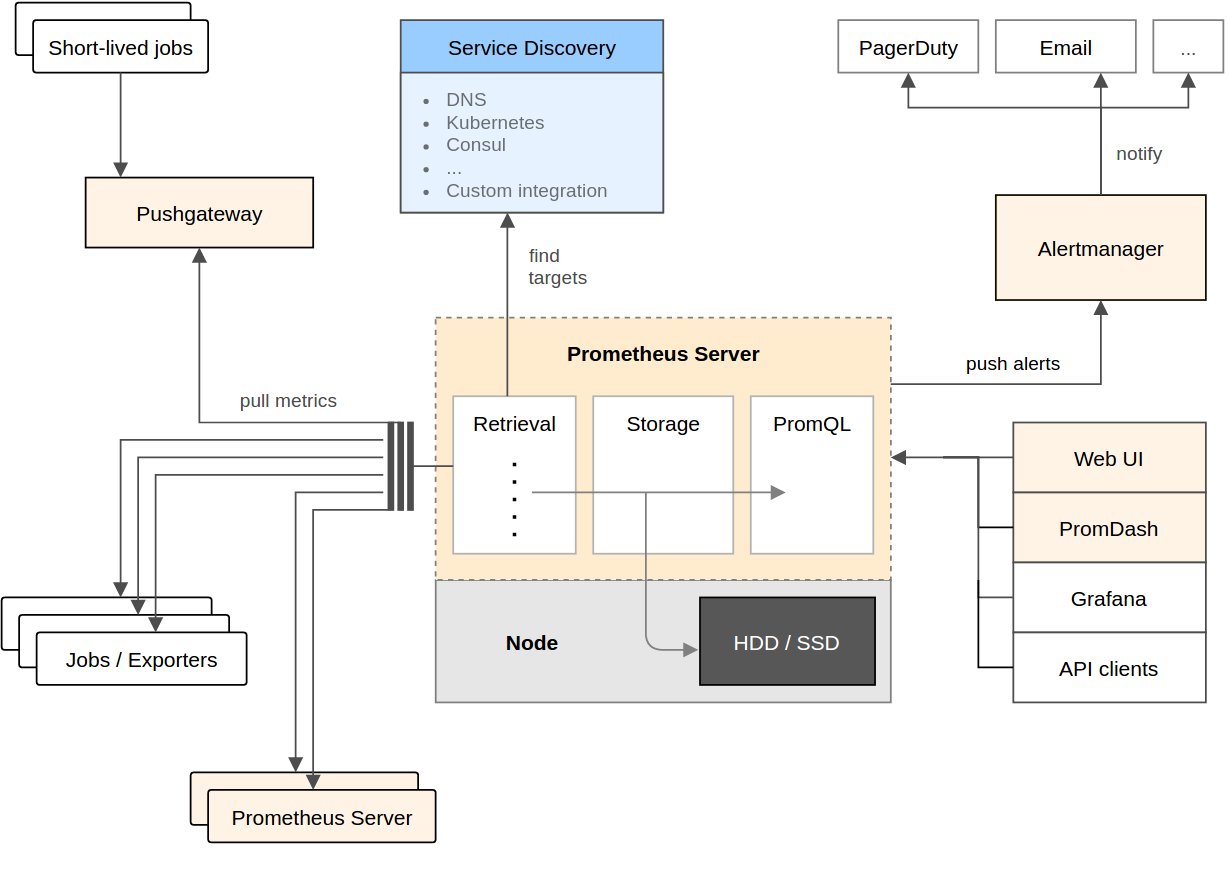
Promethues直接或通过短期Jobs的中介网关拉取收集指标。 它在本地存储所有抓取的数据样本,并对数据进行规则匹配检测,这样可以基于现有数据创建新的时间系列指标或生成警报。 PromDash或其他API使用者对收集的数据进行可视化。
引入Prometheus对k8s的影响
下图是Redhat研发人员的回答
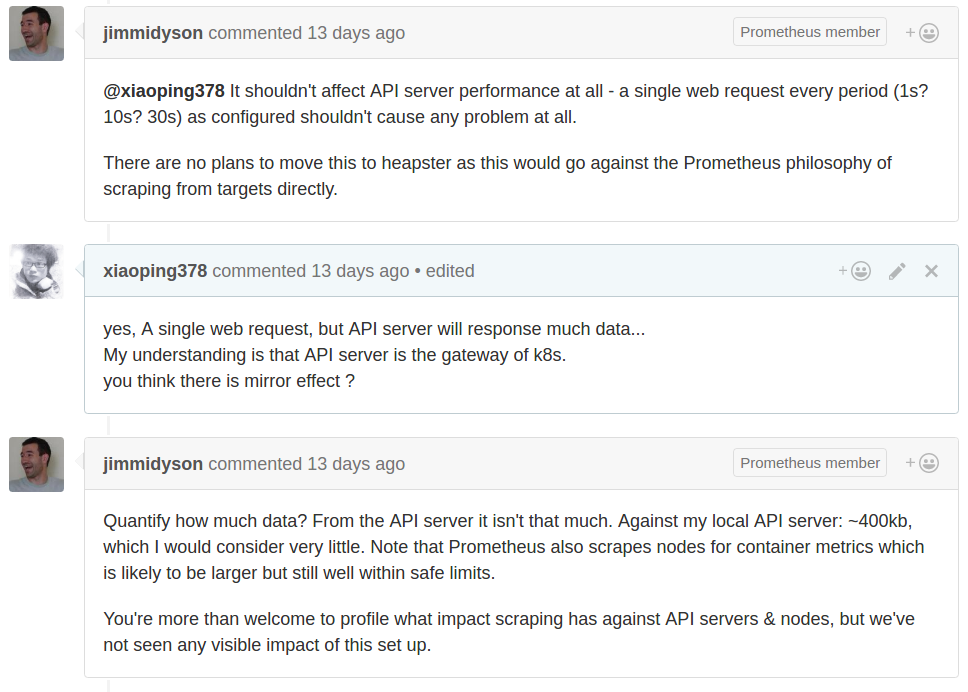
并不会对k8s产生太大的影响,其主要是通过api-server来发现需要监控的目标,然后会周期性的通过各个Node上kubelet来拉取数据。 更详细的讨论见这里
部署Prometheus
下文是基于k8s-monitor项目来说的
Prometheus is an open-source monitoring solution that includes the gathering of metrics, their storage in an internal time series database as well as querying and alerting based on that data.
It offers a lot of integrations incl. Docker, Kubernetes, etc.
Prometheus can also visualize your data. However, in this recipe we include another open-source tool, Grafana, for the visualization part, as it offers a more powerful and flexible way to generate visuals and dashboards.
If you just want to get Prometheus and Grafana up and running you can deploy the whole recipe with a single command instead of going through all steps detailed out below:
kubectl create --filename manifests/
Deploying Prometheus
First, we need to create the configuration for our Prometheus. For this we use a Config Map, which we later mount into our Prometheus pod to configure it. This way we can change the configuration without having to redeploy Prometheus itself.
kubectl create --filename manifests/prometheus-core-configmap.yaml
Then, we create a service to be able to access Prometheus.
kubectl create --filename manifests/prometheus-core-service.yaml
Finally, we can deploy Prometheus itself.
kubectl create --filename manifests/prometheus-core-deployment.yaml
Further, we need the Prometheus Node Exporter deployed to each node. For this we use a Daemon Set and a fronting service for Prometheus to be able to access the node exporters.
kubectl create --filename manifests/prometheus-node-exporter-service.yaml
kubectl create --filename manifests/prometheus-node-exporter-daemonset.yaml
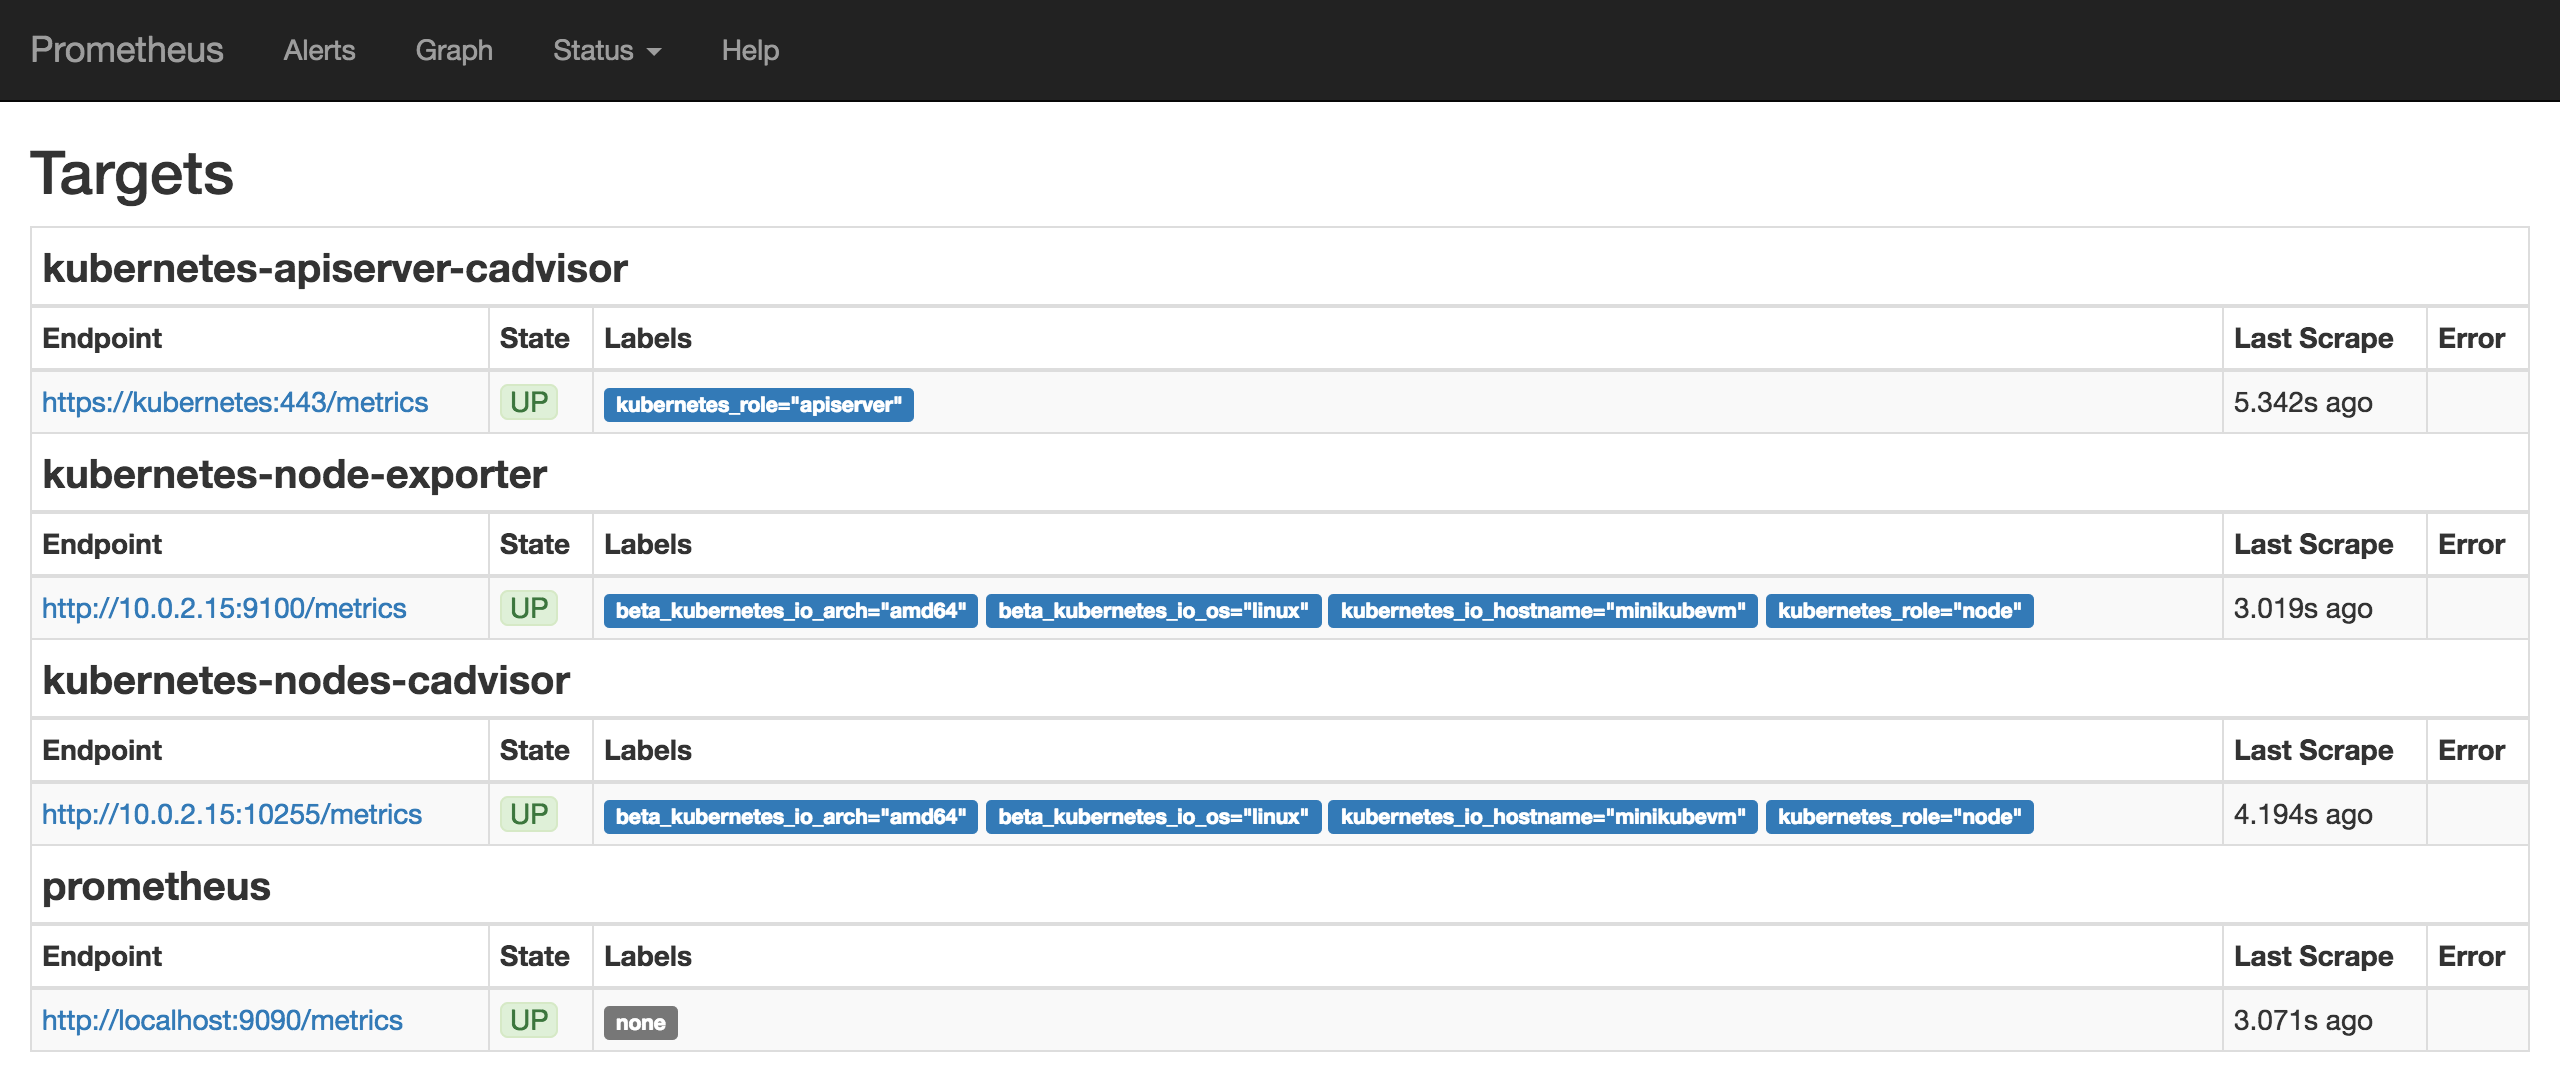
Wait a bit for all the pods to come up. Then Prometheus should be ready and running. We can check the Prometheus targets at https://mycluster.k8s.gigantic.io/api/v1/proxy/namespaces/default/services/prometheus/targets
Deploying Alertmanager
we need to create the configuration for our Alertmanager. For this we use a Config Map, which we later mount into our Alertmanager pod to configure it. This way we can change the configuration without having to redeploy Alertmanager itself.
kubectl create --filename manifests/prometheus-alert-configmap.yaml
Then, we create a service to be able to access Alertmanager.
kubectl create --filename manifests/prometheus-alert-service.yaml
Finally, we can deploy Alertmanager itself.
kubectl create --filename manifests/prometheus-alert-deployment.yaml
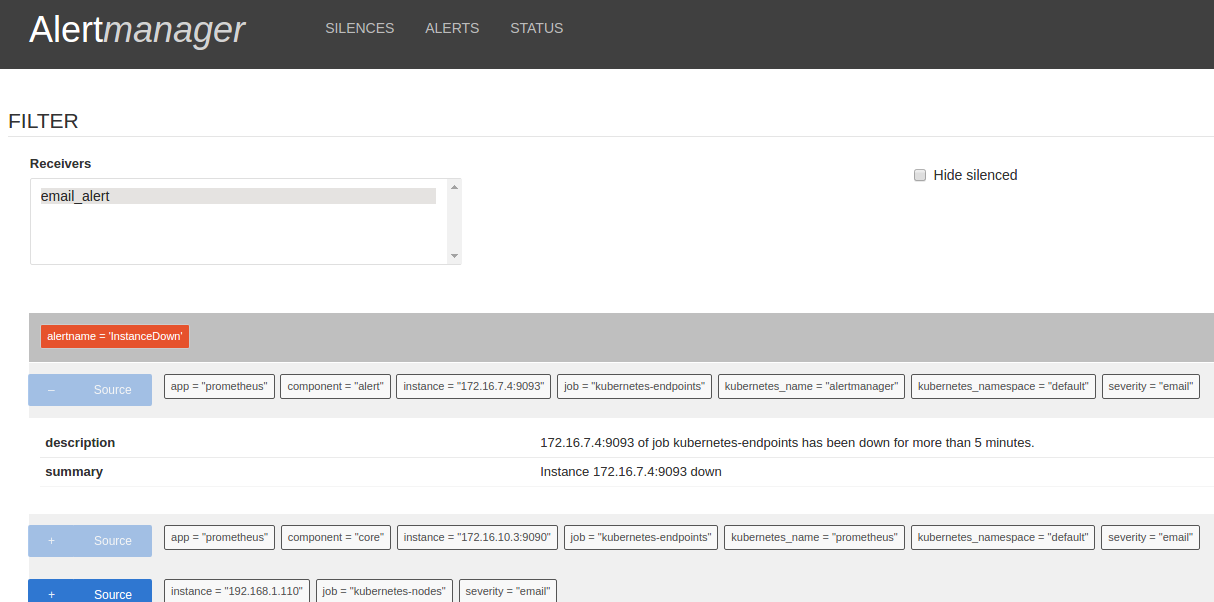
Wait a bit for all the pods to come up. Then Alertmanager should be ready and running. We can check the Alertmanager targets at https://mycluster.k8s.gigantic.io/api/v1/proxy/namespaces/default/services/alertmanager/
Deploying Grafana
Now that we have Prometheus up and running we can deploy Grafana to have a nicer frontend for our metrics.
Again, we create a service to be able to access Grafana and a deployment to manage the pods.
kubectl create --filename manifests/grafana-services.yaml
kubectl create --filename manifests/grafana-deployment.yaml
Wait a bit for Grafana to come up. Then you can access Grafana at https://mycluster.k8s.gigantic.io/api/v1/proxy/namespaces/default/services/grafana/
Setting Up Grafana
TLDR: If you don't want to go through all the manual steps below you can let the following job use the API to configure Grafana to a similar state.
kubectl create --filename manifests/grafana-import-dashboards-job.yaml
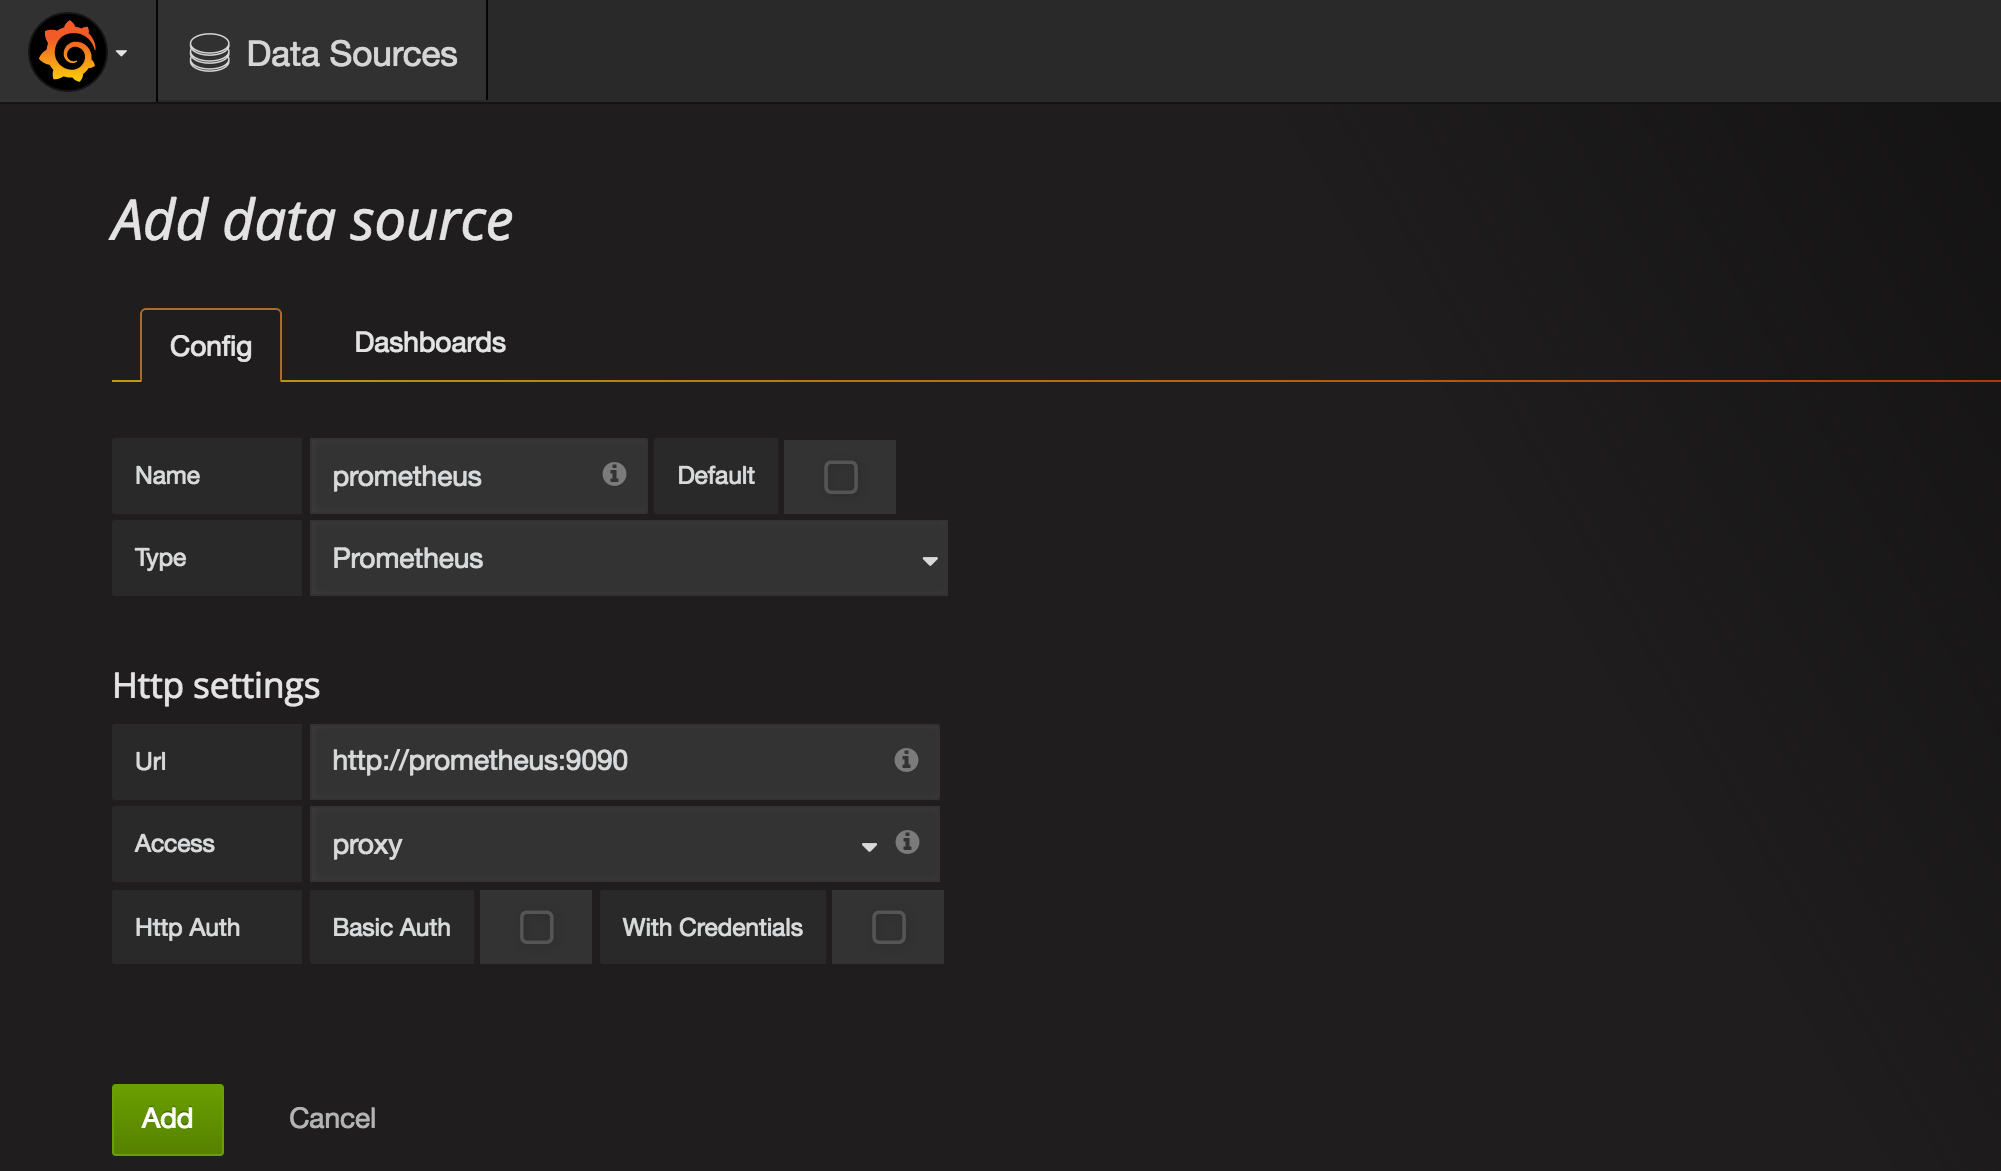
Once we're in Grafana we need to first configure Prometheus as a data source.
Grafana UI / Data Sources / Add data sourceName:prometheusType:PrometheusUrl:http://prometheus:9090Add
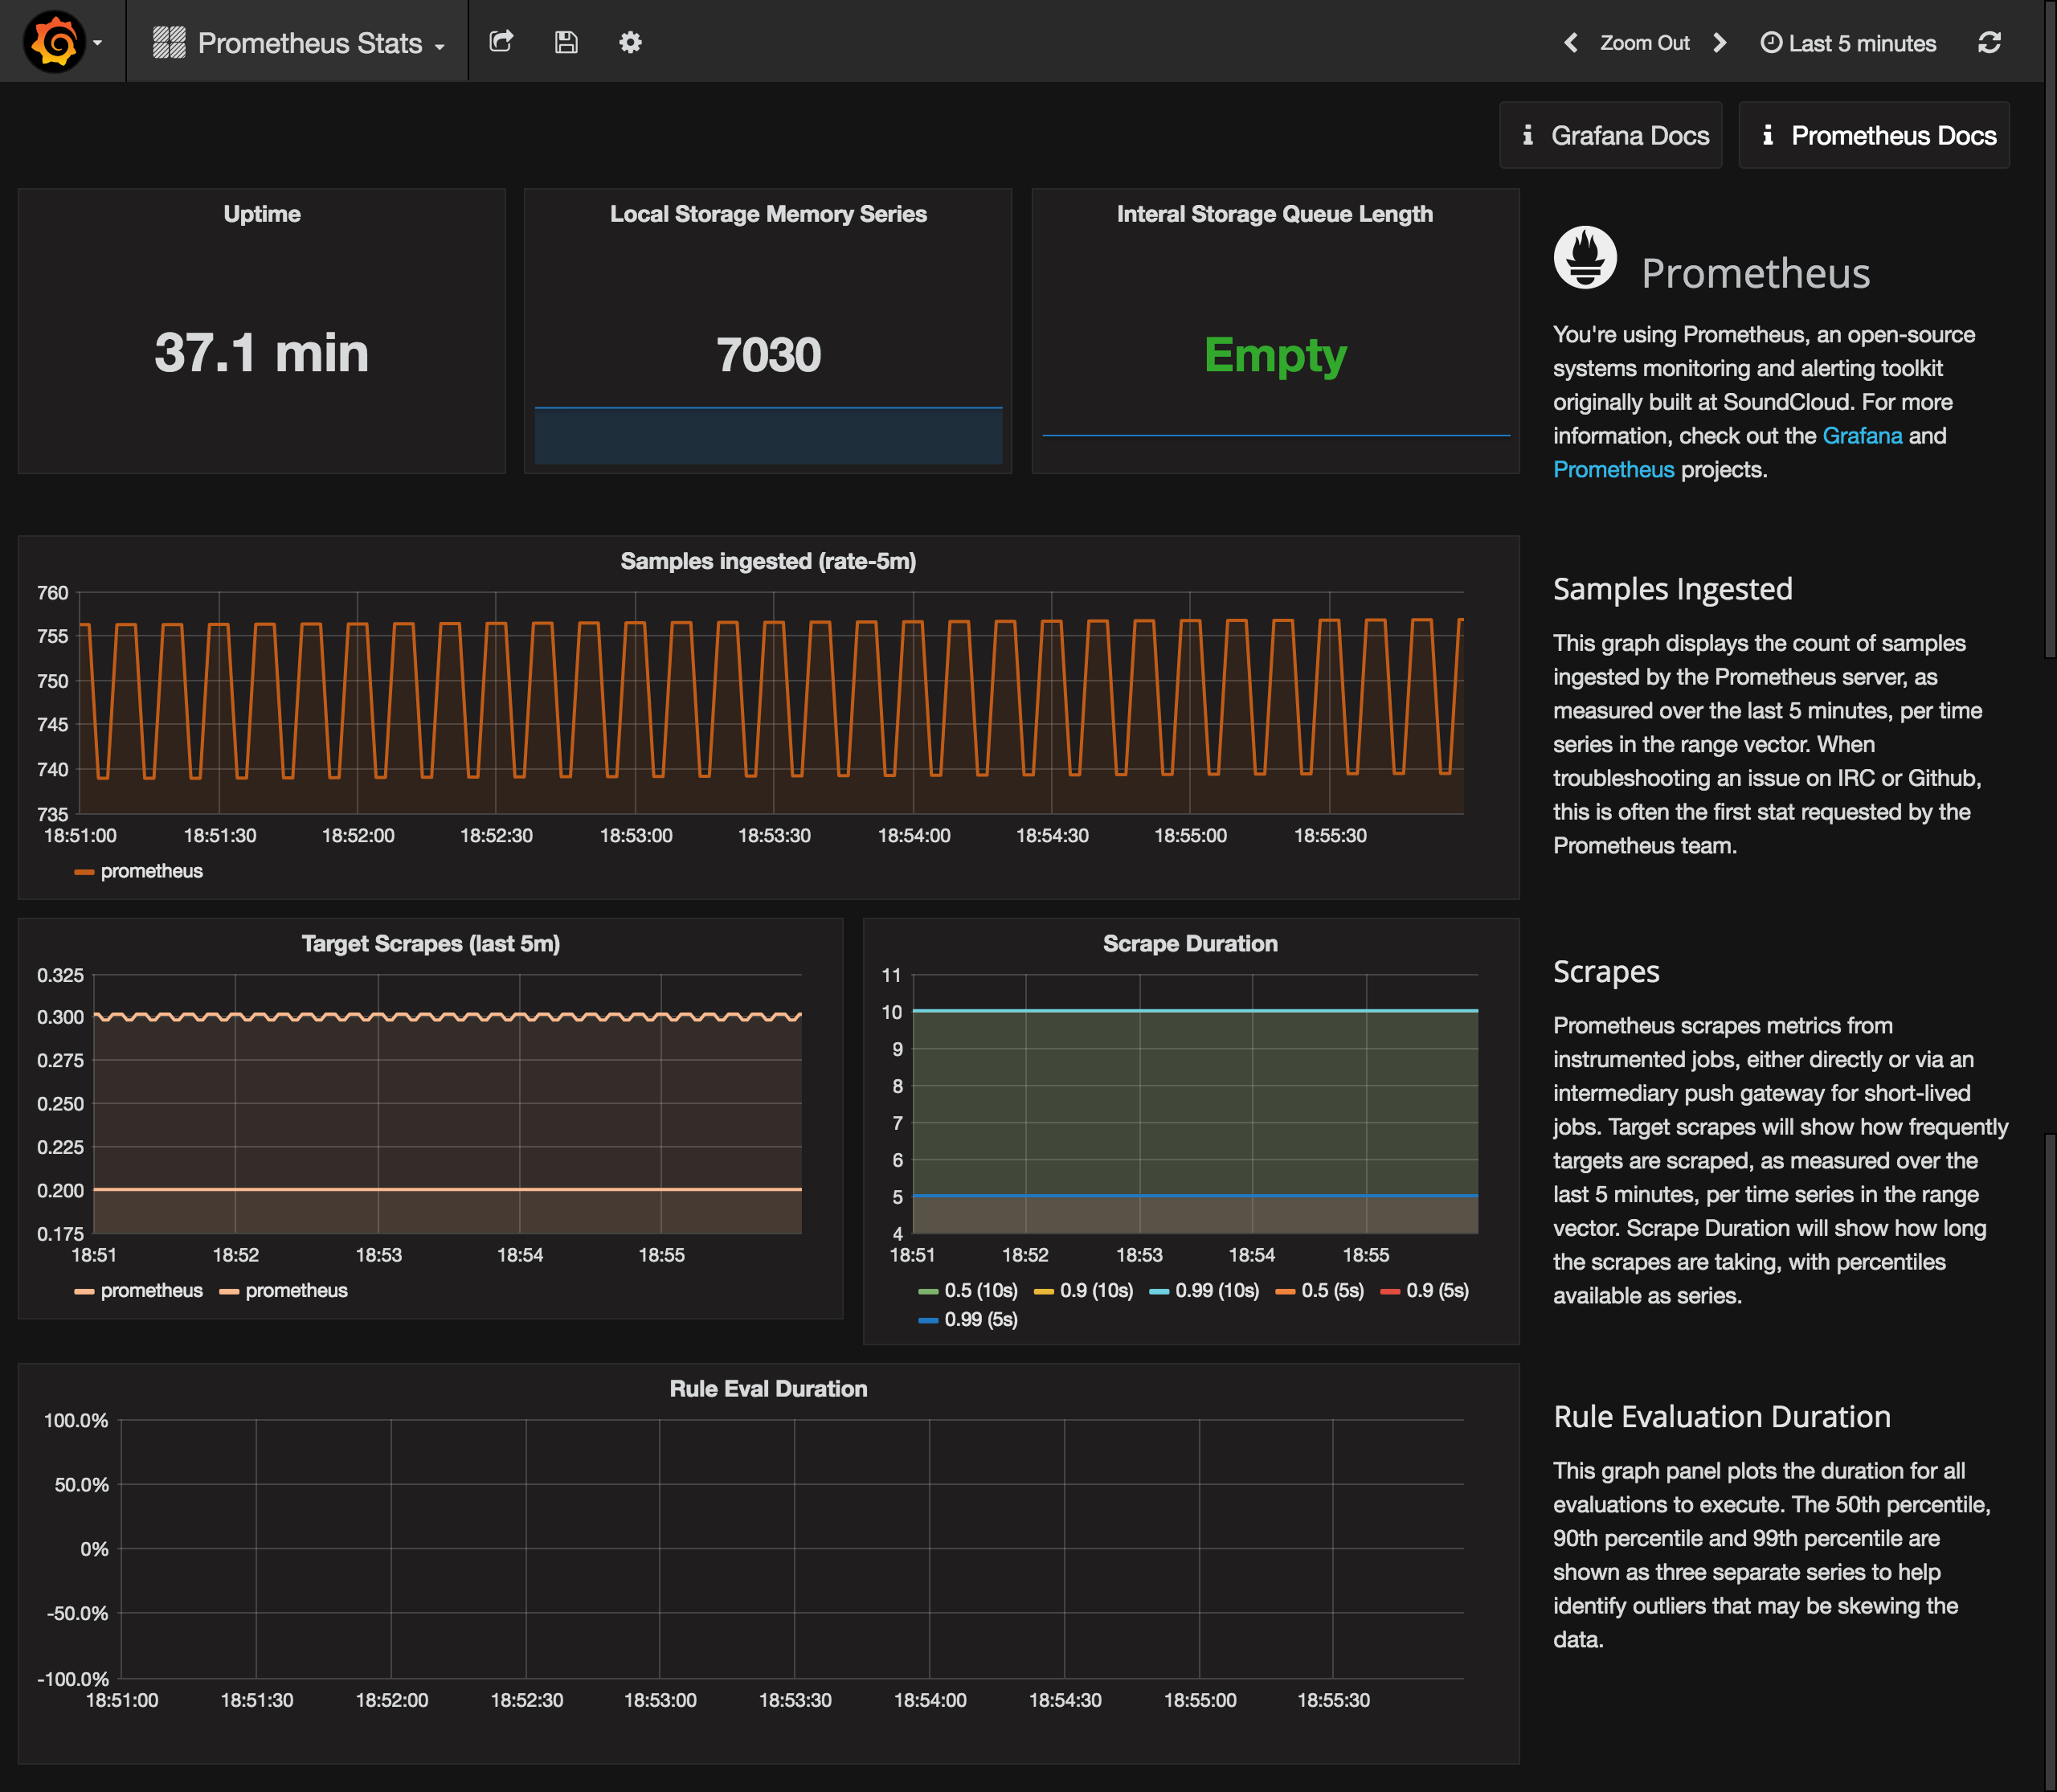
Then go to the Dashboards tab and import the Prometheus Stats dashboard, which shows the status of Prometheus itself.
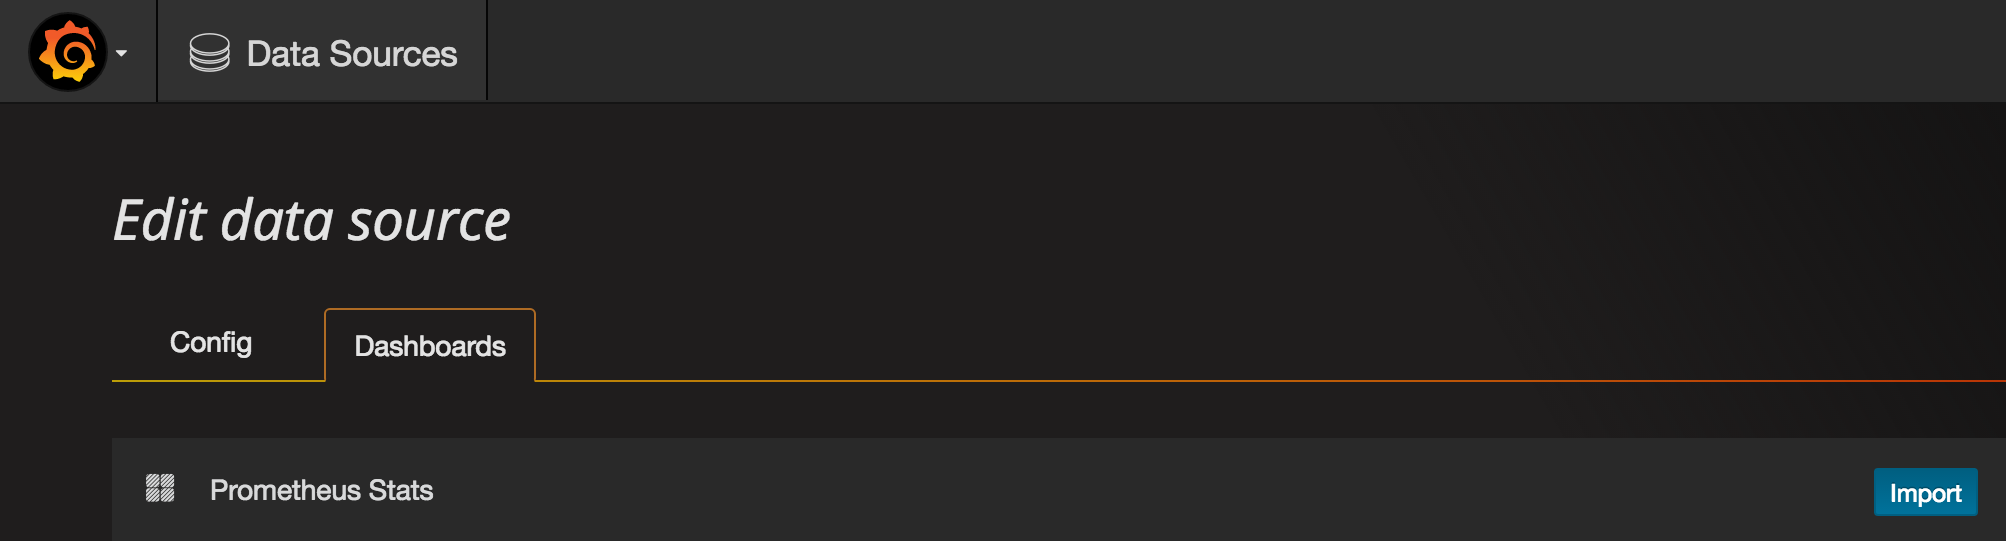
You can check it out to see how your Prometheus is doing.
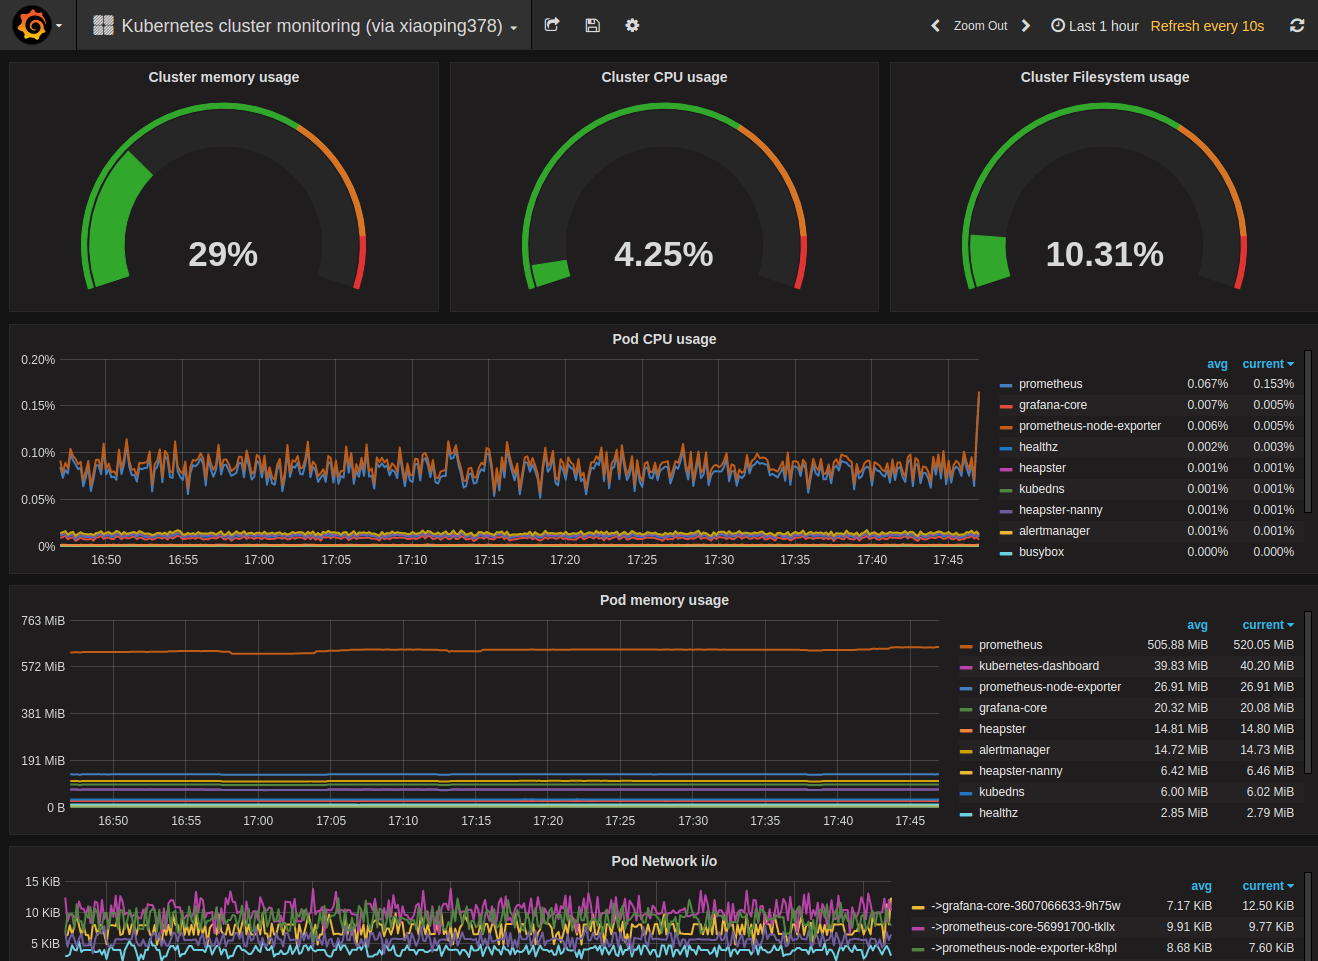
Last, but not least we can import a sample Kubernetes cluster monitoring dashboard, to get a first overview over our cluster metrics.
Grafana UI / Dashboards / ImportGrafana.net Dashboard:https://grafana.net/dashboards/597LoadPrometheus:prometheusSave & Open
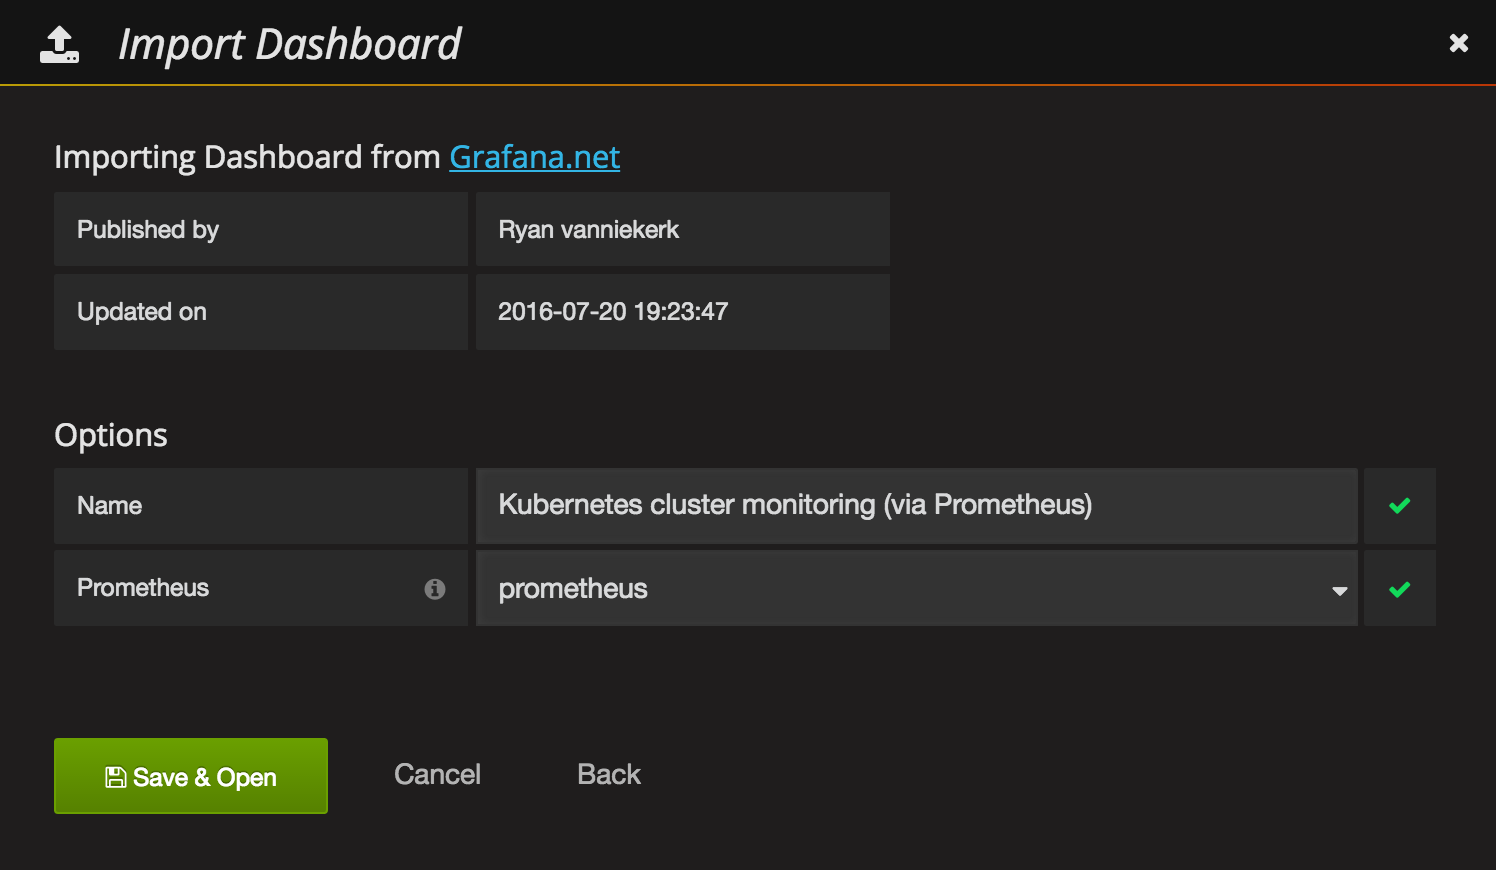
Voilá. You have a nice first dashboard with metrics of your Kubernetes cluster.
Next Steps
Next, you should get into the Grafana and Prometheus documentations to get to know the tools and either build your own dashboards or extend the samples from above.
You can also check out grafana.net for some more example dashboards and plugins.
More Alertmanager documentations in here
6 - 配置harbor默认https访问
主要介绍k8s生态中镜像仓的https访问方案
因为使用自签证书(reg.300.cn),所以需要把中间过程生成的ca.crt拷贝到需要pull/push的node上 (懒的翻译了,很详细的文档,已验证OK)
Because Harbor does not ship with any certificates, it uses HTTP by default to serve registry requests. This makes it relatively simple to configure. However, it is highly recommended that security be enabled for any production environment. Harbor has an Nginx instance as a reverse proxy for all services, you can configure Nginx to enable https.
##Getting a certificate
Assuming that your registry's hostname is reg.yourdomain.com, and that its DNS record points to the host where you are running Harbor. You first should get a certificate from a CA. The certificate usually contains a .crt file and a .key file, for example, yourdomain.com.crt and yourdomain.com.key.
In a test or development environment, you may choose to use a self-signed certificate instead of the one from a CA. The below commands generate your own certificate:
- Create your own CA certificate:
  openssl req \
    -newkey rsa:4096 -nodes -sha256 -keyout ca.key \
    -x509 -days 365 -out ca.crt
- Generate a Certificate Signing Request:
If you use FQDN like reg.yourdomain.com to connect your registry host, then you must use reg.yourdomain.com as CN (Common Name). Otherwise, if you use IP address to connect your registry host, CN can be anything like your name and so on:
  openssl req \
    -newkey rsa:4096 -nodes -sha256 -keyout yourdomain.com.key \
    -out yourdomain.com.csr
- Generate the certificate of your registry host:
On Ubuntu, the config file of openssl locates at /etc/ssl/openssl.cnf. Refer to openssl document for more information. The default CA directory of openssl is called demoCA. Let's create necessary directories and files:
  mkdir demoCA
  cd demoCA
  touch index.txt
  echo '01' > serial
  cd ..
If you're using FQDN like reg.yourdomain.com to connect your registry host, then run this command to generate the certificate of your registry host:
openssl ca -in yourdomain.com.csr -out yourdomain.com.crt -cert ca.crt -keyfile ca.key -outdir .
If you're using IP to connect your registry host, you may instead run the command below:
  echo subjectAltName = IP:your registry host IP > extfile.cnf

  openssl ca -in yourdomain.com.csr -out yourdomain.com.crt -cert ca.crt -keyfile ca.key -extfile extfile.cnf -outdir .
##Configuration of Nginx After obtaining the yourdomain.com.crt and yourdomain.com.key files, change the directory to Deploy/config/nginx in Harbor project.
cd Deploy/config/nginx
Create a new directory cert/, if it does not exist. Then copy yourdomain.com.crt and yourdomain.com.key to cert/, e.g. :
  cp yourdomain.com.crt cert/
  cp yourdomain.com.key cert/
Rename the existing configuration file of Nginx:
mv nginx.conf nginx.conf.bak
Copy the template nginx.https.conf as the new configuration file:
cp nginx.https.conf nginx.conf
Edit the file nginx.conf and replace two occurrences of harbordomain.com to your own host name, such as reg.yourdomain.com . If you use a customized port rather than the default port 443, replace the port "443" in the line "rewrite ^/(.*) https://$server_name:443/$1 permanent;" as well. Please refer to the installation guide for other required steps of port customization.
  server {
    listen 443 ssl;
    server_name harbordomain.com;

    ...

  server {
    listen 80;
    server_name harbordomain.com;
    rewrite ^/(.*) https://$server_name:443/$1 permanent;
Then look for the SSL section to make sure the files of your certificates match the names in the config file. Do not change the path of the files.
    ...

    # SSL
    ssl_certificate /etc/nginx/cert/yourdomain.com.crt;
    ssl_certificate_key /etc/nginx/cert/yourdomain.com.key;
Save your changes in nginx.conf.
##Installation of Harbor Next, edit the file Deploy/harbor.cfg , update the hostname and the protocol:
  #set hostname
  hostname = reg.yourdomain.com
  #set ui_url_protocol
  ui_url_protocol = https
Generate configuration files for Harbor:
./prepare
If Harbor is already running, stop and remove the existing instance. Your image data remain in the file system
  docker-compose stop
  docker-compose rm
Finally, restart Harbor:
docker-compose up -d
After setting up HTTPS for Harbor, you can verify it by the following steps:
-
Open a browser and enter the address: https://reg.yourdomain.com . It should display the user interface of Harbor.
-
On a machine with Docker daemon, make sure the option "-insecure-registry" does not present, and you must copy ca.crt generated in the above step to /etc/docker/certs.d/yourdomain.com(or your registry host IP), if the directory does not exist, create it. If you mapped nginx port 443 to another port, then you should instead create the directory /etc/docker/certs.d/yourdomain.com:port(or your registry host IP:port). Then run any docker command to verify the setup, e.g.
docker login reg.yourdomain.com
If you've mapped nginx 443 port to another, you need to add the port to login, like below:
docker login reg.yourdomain.com:port
##Troubleshooting
-
You may get an intermediate certificate from a certificate issuer. In this case, you should merge the intermediate certificate with your own certificate to create a certificate bundle. You can achieve this by the below command:
cat intermediate-certificate.pem >> yourdomain.com.crt -
On some systems where docker daemon runs, you may need to trust the certificate at OS level. On Ubuntu, this can be done by below commands:
cp youdomain.com.crt /usr/local/share/ca-certificates/reg.yourdomain.com.crt
update-ca-certificates
On Red Hat (CentOS etc), the commands are:
cp yourdomain.com.crt /etc/pki/ca-trust/source/anchors/reg.yourdomain.com.crt
update-ca-trust
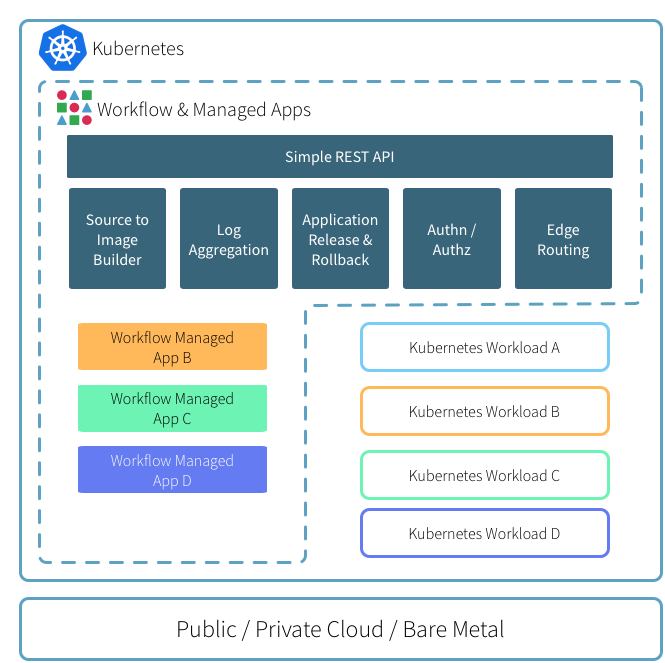
7 - DEIS 开源PAAS平台实践
DEIS 开源的PAAS平台实践总结。
DEIS(目前已被微软收购)的workflow是开源的Paas平台,基于kubernetes做了一层面向开发者的CLI和接口,做到了让开发者对容器无感知的情况下快速的开发和部署线上应用。
workflow是 on top of k8s的,所有组件默认全是跑在pod里的,不像openshift那样对k8s的侵入性很大。
特性如下:
- S2I(自动识别源码直接编译成镜像)
- 日志聚合
- 应用管理(发布,回滚)
- 认证&授权机制
- 边界路由
下面从环境搭建,安装workflow及其基本使用做个梳理。
初始化k8s集群
可以通过k8s-deploy项目来离线安装高可用kubernetes集群,我这里是单机演示环境。
kubeadm init --kubernetes-version v1.6.2 --pod-network-cidr 12.240.0.0/12
#方便命令自动补全
source <(kubectl completion zsh)

#安装cni网络
cp /etc/kubernetes/admin.conf $HOME/.kube/config
kubectl apply -f kube-flannel-rbac.yml
kubectl apply -f kube-flannel.yml

#使能master可以被调度
kubectl taint node --all  node-role.kubernetes.io/master-

#安装ingress-controller, 边界路由作用
kubectl create -f ingress-traefik-rbac.yml
kubectl create -f ingress-traefik-deploy.yml
初始化helm
helm相当于kubernetes里的包管理器,类似yum和apt的作用,只不过它操作的是charts(各种k8s yaml文件的集合,额外还有Chart.yaml -- 包的描述文件)可以理解为基于k8s的应用模板管理类工具, 后面会用它来安装workflow到上面跑起来的k8s集群里。
从k8s 1.6之后,kubeadm安装的集群,默认会开启RBAC机制,为了让helm可以安装任何应用,我们这里赋予tiller cluster-admin权限
kubectl create serviceaccount helm --namespace kube-system
kubectl create clusterrolebinding cluster-admin-helm --clusterrole=cluster-admin --serviceaccount=kube-system:helm
初始化helm:
➜  helm init --service-account helm
$HELM_HOME has been configured at /home/xxp/.helm.

Tiller (the helm server side component) has been installed into your Kubernetes Cluster.
Happy Helming!

➜  helm version
Client: &version.Version{SemVer:"v2.4.1", GitCommit:"46d9ea82e2c925186e1fc620a8320ce1314cbb02", GitTreeState:"clean"}
Server: &version.Version{SemVer:"v2.4.1", GitCommit:"46d9ea82e2c925186e1fc620a8320ce1314cbb02", GitTreeState:"clean"}
安装后,默认导入了2个repos,后面安装和搜索应用时,都是从这2个仓里出的,当然也可以自己通过helm repo add添加本地私有仓
➜  helm repo list
NAME  	URL
stable	https://kubernetes-charts.storage.googleapis.com
local 	http://127.0.0.1:8879/charts
helm的使用基本流程如下:
- helm search: 搜索自己想要安装的应用(chart)
- helm fetch: 下载应用(chart)到本地,可以忽略此步
- helm install: 安装应用
- helm list: 查看已安装的应用情况
安装workflow
添加workflow的repo仓
helm repo add deis https://charts.deis.com/workflow
开始安装workflow,因为RBAC的原因,同样要赋予workflow各组件相应的权限,yml文件在[这里](https://gist.github.com/xiaoping378/798c39e0b607be4130db655f4873bd24)
kubectl apply -f workflow-rbac.yml --namespace deis

helm install deis/workflow --name workflow --namespace deis \
  --set global.experimental_native_ingress=true,controller.platform_domain=192.168.31.49.xip.io
其中会拉取所需镜像,不出意外会有如下结果:
➜  kubectl --namespace=deis get pods
NAME                                     READY     STATUS    RESTARTS   AGE
deis-builder-1134410811-11xpp            1/1       Running   0          46m
deis-controller-2000207379-5wr10         1/1       Running   1          46m
deis-database-244447703-v2sh9            1/1       Running   0          46m
deis-logger-2533678197-pzmbs             1/1       Running   2          46m
deis-logger-fluentd-08hms                1/1       Running   0          42m
deis-logger-redis-1307646428-fz1kk       1/1       Running   0          46m
deis-minio-3195500219-tv7wz              1/1       Running   0          46m
deis-monitor-grafana-59098797-mdqh1      1/1       Running   0          46m
deis-monitor-influxdb-168332144-24ngs    1/1       Running   0          46m
deis-monitor-telegraf-vgbr9              1/1       Running   0          41m
deis-nsqd-1042535208-40fkm               1/1       Running   0          46m
deis-registry-2249489191-2jz3p           1/1       Running   2          46m
deis-registry-proxy-qsqc2                1/1       Running   0          46m
deis-router-3258454730-3rfpq             1/1       Running   0          41m
deis-workflow-manager-3582051402-m11zn   1/1       Running   0          46m
注册管理用户
由于我们是本地ingress-controller, 必须保障deis-builder.$host可以被解析, 自行创建ingress of deis-builder.
kubectl apply -f deis-buidler-ingress.yml
确保traefik有如下状态:
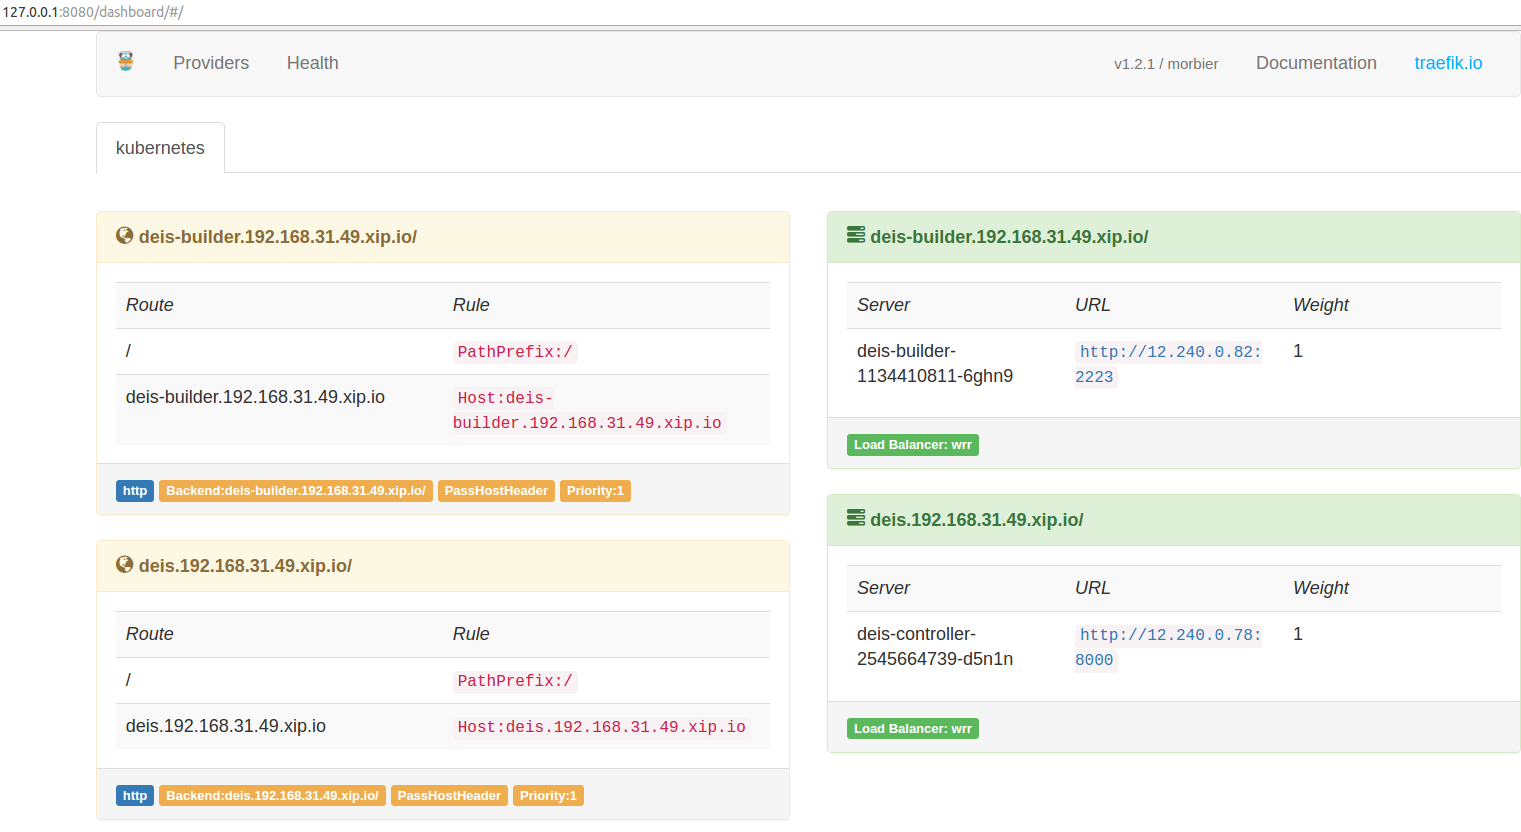
如下操作注册,默认第一个用户为管理员用户,可操作所有其他用户。
➜  ~ kubectl get --namespace deis ingress
NAME                                 HOSTS                               ADDRESS   PORTS     AGE
builder-api-server-ingress-http      deis-builder.192.168.31.49.xip.io             80        18m
controller-api-server-ingress-http   deis.192.168.31.49.xip.io                     80        1h
➜  ~
➜  ~ deis register deis.192.168.31.49.xip.io
username: admin
password:
password (confirm):
email: xiaoping378@163.com
Registered admin
Logged in as admin
Configuration file written to /home/xxp/.deis/client.json
➜  ~
➜  ~ deis whoami
You are admin at http://deis.192.168.31.49.xip.io
部署第一个应用
8 - k3s实践-01
k3s的安装及基本工作方式解读
本文主要介绍k3s的安装和核心组件解读。
k3s是all-in-one的轻量k8s发行版,把所有k8s组件打包成一个不到100M的二进制文件了。具备如下显著特点:
- 打包成单一二进制
- 默认集成了sqlite3来替代etcd,也可以指定其他数据库:etcd3、mysql、postgres。
- 默认内置Coredns、Metrics Server、Flannel、Traefik ingress、Local-path-provisioner等
- 默认启用了TLS加密通信。
安装
官方提供了一键安装脚本install.sh ,执行curl -sfL https://get.k3s.io | sh -可一键安装server端。此命令会从https://update.k3s.io/v1-release/channels/stable取到最新的稳定版安装,可以通过INSTALL_K3S_VERSION环境变量指定版本,本文将以1.19为例。
启动 k3s server端(master节点).
curl -sfL https://get.k3s.io | INSTALL_K3S_VERSION=v1.19.16+k3s1 sh -
由于网络原因,可能会失败,自行想办法下载下来,放置
/usr/local/bin/k3s,附上执行权限chmod a+x /usr/local/bin/k3s, 然后上面的命令加上INSTALL_K3S_SKIP_DOWNLOAD=true再执行一遍即可。
安装里log里会输出一些重要信息:
kubectl、crictl、卸载脚本、systemd service
不出意外,k3s server会被systemd启动,执行命令查看systemctl status k3s或者通过软链的kubectl验证是否启动成功:
➜  kubectl get no
NAME            STATUS   ROLES    AGE     VERSION
gitlab-server   Ready    master   6m43s   v1.19.16+k3s1
(Optional) 启动 k3s agent端 (添加worker节点).
curl -sfL https://get.k3s.io | K3S_URL=https://172.25.11.130:6443 K3S_TOKEN=bulabula INSTALL_K3S_VERSION=v1.19.16+k3s1 sh -
K3S_TOKEN内容需要从server端的/var/lib/rancher/k3s/server/node-token文件取出K3S_URL中的IP是master节点的IP。
集群访问
默认kubectl通过localhost访问本地集群,所以上文敲kubectl是没问题的,如果要被外部访问或者纳管的话,可以把kubeconfig文件拷走,默认路径是 /etc/rancher/k3s/k3s.yaml
。记得修改文件内的server字段,改成外部可访问到的IP。
架构说明
TODO.
9 - kubeshere 自研-01
自研系列文章整理。
kubesphere 自研环境篇
心态
首先调整心态,这是一个新的生态,秉承学习的心态。
准备环境
- clone代码
git clone https://github.com/kubesphere/kubesphere.git
- 准备开发环境
10 - TKEStack all-in-one入坑指南
TkeStack的all-in-one安装、多租户和多集群管理功能解读。
本文主要介绍当前最新版本TkeStack 1.8.1 的TKEStack的all-in-one安装、多租户和多集群管理功能解读。
安装实录
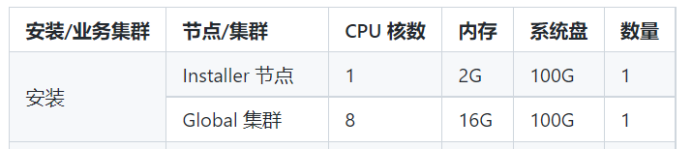
官方推荐至少需要2节点方可安装,配置如下,硬盘空间一定要保障。也支持ALL-in-ONE的方式安装,但有BUG。
启动init服务
启动init服务,即安装tke-installer和registry服务,安装命令行如下:
arch=amd64 version=v1.8.1 \
    && wget https://tke-release-1251707795.cos.ap-guangzhou.myqcloud.com/tke-installer-linux-$arch-$version.run{,.sha256} \
    && sha256sum --check --status tke-installer-linux-$arch-$version.run.sha256 \
    && chmod +x tke-installer-linux-$arch-$version.run \
    && ./tke-installer-linux-$arch-$version.run
如上命令执行后,会下载8G左右的安装包,并执行解压后的install.sh脚本,启动3个容器:1个为tke-installer和另2个为registry仓,且为containerd容器,需要使用nerdctl [images | ps]等命令查看相关信息。
通过查看脚本,上文启动的本地registry的启动命令等效如下:
nerdctl run --name registry-https -d --net=host --restart=always -p 443:443 \
    -v /opt/tke-installer/registry:/var/lib/registry \
    -v registry-certs:/certs \
    -e REGISTRY_HTTP_ADDR=0.0.0.0:443 \
    -e REGISTRY_HTTP_TLS_CERTIFICATE=/certs/server.crt \
    -e REGISTRY_HTTP_TLS_KEY=/certs/server.key  \
    tkestack/registry-amd64:2.7.1
还有个http 80的registry,这里不贴了,后面的部分坑,就是这里埋下的,预先占用了节点的80和443端口,后面tke的gateway pod会启动失败。
启动TKE集群
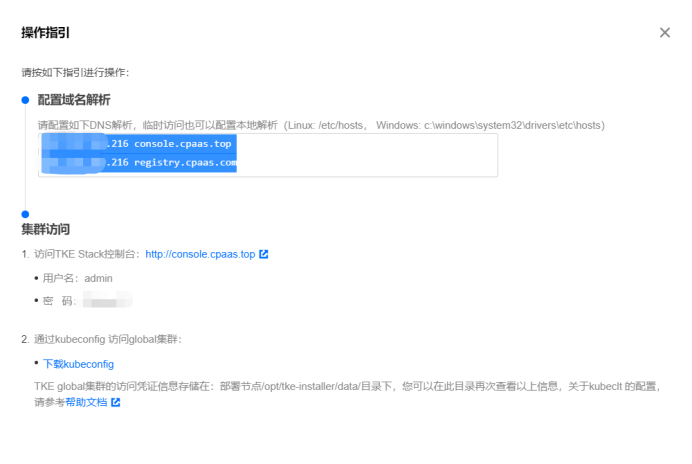
上章节执行完后,会启动tke-installer(一个web操作台),通过访问本地8080端口,可访问界面操作安装global集群。按照官方指引操作就行,此处不表。另外需要说明的是在安装过程中,如果要查看本地容器,不能使用docker ps了,需要使用nerdctl -n k8s.io ps。整个安装过程是使用ansible和kubeadm完成的,kubelet是通过systemd启动的,k8s组件为静态pod。
因为我是使用的ALL-in-ONE安装,遇到了不少问题,可详见FAQ如何解决。安装成功后会提示如下指引:
默认初始安装后,很多pod是双副本的,我这里仅是验证功能使用,全部改成了单副本。
多租户管理
tkestack采用Casbin框架实现的权限管理功能,默认集成的Model,查看源码得知:
[request_definition]
r = sub, dom, obj, act
[policy_definition]
p = sub, dom, obj, act, eft
[role_definition]
g = _, _, _
[policy_effect]
e = some(where (p.eft == allow)) && !some(where (p.eft == deny))
[matchers]
m = g(r.sub, p.sub, r.dom) && keyMatchCustom(r.obj, p.obj) && keyMatchCustom(r.act, p.act)
实现了多租户级的RBAC权限模型。
FAQ
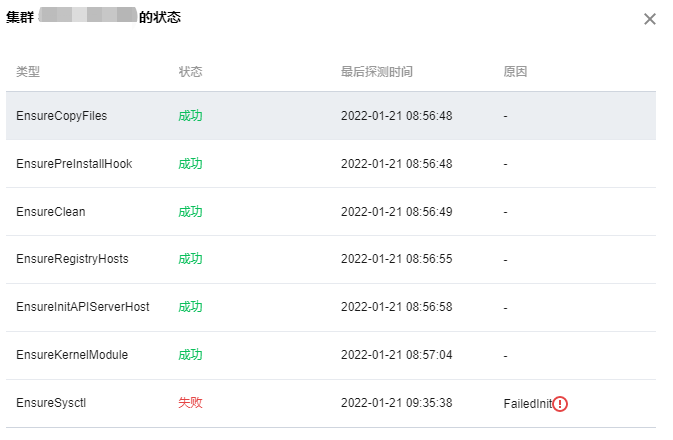
安装过程出现循环等待apiserver启动
2022-01-19 14:43:32.225 error tke-installer.ClusterProvider.OnCreate.EnsureKubeadmInitPhaseWaitControlPlane check healthz error {"statusCode": 0, "error": "Get \"https://****:6443/healthz?timeout=30s\": net/http: TLS handshake timeout"}
我这里是因为在installer上指定的master的IP为外网IP(我使用外网IP是有原因的,穷... 后面需要跨云厂商组集群),通过查看kubelet日志提示本机找不到IP,如下开启网卡多IP,可通过。
ip addr add 118.*.*.* dev eth0
Gateway POD启动失败
我这里是因为init节点和gobal master节点,共用了一个,本registry服务占用了80和443端口,需要修改gateway hostNetwork为false,另外可以通过修改svc 为nodePort,还需要修改targetPort,官方现在这里有bug,不知道为指到944*的端口上,我这里设置的30080来访问安装好的集群。
页面登录错误Unregistered redirect_uri
官方没有相关说明,一切都是ALL-in-ONE的原因,我改动了默认集群console的访问端口为30080。。。 通过查看源码发现是每次认证时dex会校验tke-auth-api向它注册过的合法client地址。于是我就修改了tke命名空间下tke-auth-api的相关configmap:
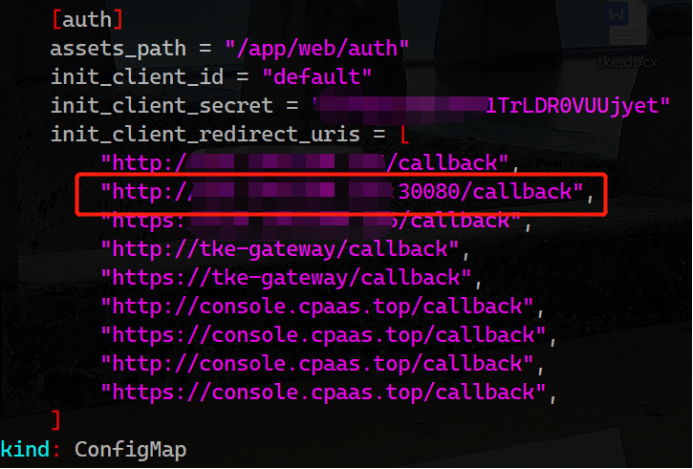
重启tke-auth-api后,问题依旧存在,继续源码走查,发现这玩意儿叫init真的只发挥一次作用,改完配置,不会重新读取,细读逻辑发现etcd中不存在这个key,会重新读取写入一次,于是决定删除etcd中的相关key。
etcdctl --cacert=/etc/kubernetes/pki/etcd/ca.crt --cert=/etc/kubernetes/pki/apiserver-etcd-client.crt --key=/etc/kubernetes/pki/apiserver-etcd-client.key del /tke/auth-api/client/default --prefix
添加节点的过程中failed,无法删除节点重试
ssh信息设置完后,如果中间出问题,会陷入无限重试...
遇事不决,看日志,找不到日志,看源码...
通过翻找源码,发现是platform相关组件在负责,查看相关日志kubectl -n logs tke-platform-controller-*** --tail 100 -f,定位问题,我这里是以前各种安装的残留信息,导致添加节点初始化失败。删除之... 解决。
为避免添加节点no clean再次出现问题,建议预先执行下clean.sh脚本。
小技巧
如下使用,可以愉快的敲命令了,因为我是用oh-my-zsh的shell主题(没有自动加载kubectl plugin),kubectl的命令补全使用zsh,可根据实际情况调整。
source <(nerdctl completion bash)
source <(kubectl completion zsh)